Announcement

Collapse
No announcement yet.

last bar on daily charts

Collapse
X
 
  • Filter
  • Time
  • Show
Clear All
new posts

  • last bar on daily charts

    Hello,

    I have reported this issue several times on eSingal forum and have not received satisfactory answer yet. So I am starting this new thread to discuss this issue one more time.

    The older threads I started before on this issue are


    Maybe there are more, but I did not go through all my post to find out them all.

    Basically the problem is sometimes after eSignal is started, the last candlestick bar on some daily chart only shows a very narrow range bar (same open/high/low/close prices) and then it is updated normally when new trades coming in. So I suspect that if the realtime trade data arrive before the daily OHLC sequence is received, these realtime trades would be used to build the last daily bar. Once this last daily bar exists, even if the historical daily OHLC sequence contains a snapshot daily bar for the current trading day up to the time eSignal is started, this snapshot is discarded.

    This issue can be solved by ctrl-click "OK" button in cursor window to reload the daily data. But it is a neat solution because I am tired of going through all daily charts on the page to check whether the last daily bar is correct or not and whether I should reload it or not.

    I am uploading two charts to demostrate the issue.
    The first chart is the screenshot after eSignal is started (it has run for a while, so the last bar is no longer a short horizontal line any more).


    Can someone check the source code to see what is exactly causing the problem?

    Thanks in advance.

    - Clearpicks
    Attached Files

  • #2
    The second screenshot is captured after the chart is reloaded. Obviously in the first chart it dis not contains all trades of the current day before eSignal was started.
    Attached Files

    Comment


    • #3
      Daily charts need to be kick-started

      I've been having a similar problem for a very long time. Before the market opens the daily candle is correct for the previous day. But when the market opens, a new daily candle does not start until I Ctrl-click "OK" in each chart. This happens less frequently on some of my 65 minute charts as well.

      I thought this problem might be an efs issue, except that I run the same efs's in my 1, 5 and 15 minute charts where this starting problem does not occur. I can tell in my 5 minute chart that the daily bar has not started when I see vertical lines connecting indicators in the 5 minute chart that rely on daily data (i.e. pivots levels). After Ctrl-clicking OK in the daily chart, the vertical lines in the 5 minute chart disappear.

      Having to click OK to start charts is annoying, especially when a stock has gapped up or down to a key support or resistance level and I am trying to gauge whether that level will hold. Clicking daily charts to start them has resulted in my missing or entering trades late in intraday charts. Is there a fix for this?

      Regards
      Shaeffer

      Comment


      • #4
        Re: Daily charts need to be kick-started

        Shaeffer
        Based on an exchange we had in a different thread it is my understanding that you are still running version 8.x.
        If that is the case then as far as I know the issue you are describing ie that the current daily bar does not form (in particular with indexes) was resolved in version 10.1
        Alex


        Originally posted by shaeffer
        I've been having a similar problem for a very long time. Before the market opens the daily candle is correct for the previous day. But when the market opens, a new daily candle does not start until I Ctrl-click "OK" in each chart. This happens less frequently on some of my 65 minute charts as well.

        I thought this problem might be an efs issue, except that I run the same efs's in my 1, 5 and 15 minute charts where this starting problem does not occur. I can tell in my 5 minute chart that the daily bar has not started when I see vertical lines connecting indicators in the 5 minute chart that rely on daily data (i.e. pivots levels). After Ctrl-clicking OK in the daily chart, the vertical lines in the 5 minute chart disappear.

        Having to click OK to start charts is annoying, especially when a stock has gapped up or down to a key support or resistance level and I am trying to gauge whether that level will hold. Clicking daily charts to start them has resulted in my missing or entering trades late in intraday charts. Is there a fix for this?

        Regards
        Shaeffer

        Comment


        • #5
          shaeffer,

          The issue you reported is kind of different from what I reported. The issue I reported might happen randomly but regardless of when eSignal is started. Therefore it is possible some daily charts show last bar correctly while some other daily charts show incorrectly last bar. It seems all depend on the timing of when historical data sequence and realtime streaming data are received respectively.

          - Clearpicks

          Comment


          • #6
            Re: Re: Daily charts need to be kick-started

            Originally posted by Alexis C. Montenegro
            Shaeffer
            Based on an exchange we had in a different thread it is my understanding that you are still running version 8.x.
            If that is the case then as far as I know the issue you are describing ie that the current daily bar does not form (in particular with indexes) was resolved in version 10.1
            Alex
            Hi Alex,

            Thanks for the reply. As a US equities trader, it seems to me that since the late 7.x releases eSignal has given up on trying to catch up to TradeStation (i.e. with quote list formulas, 60 minute charts that end at 4:00pm, multi-thread design, % change Y-axis in Adv charts, just to name a few absent features) so I had not seen a reason to upgrade. But not having to kick-start daily charts at the market open is an important enough improvement that I just upgraded to 10.1 (and I didn't have to copy anything over from my saved 8.0 directory, so the upgrade process is improved too).

            The only thing strange is I'm seeing yesterdays daily candle duplicated today (one hour before the open) on every daily chart. Any idea why? Hopefully this duplicate candle will change at the open.

            Regards
            Shaeffer

            Comment


            • #7
              Re: Re: Re: Daily charts need to be kick-started

              Shaeffer
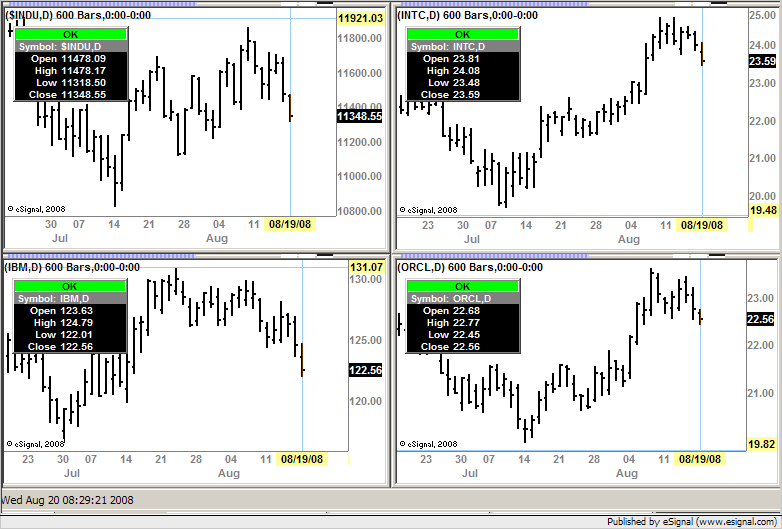
              FWIW I just tried opening some daily charts around an hour before market opening and as you can see in the enclosed screenshot (captured at 8:29 EDT) these are not displaying a duplicate candle. As I had the application running for a while prior to opening these charts I also restarted eSignal and the Data Manager and ran the test again with the same results as shown
              Alex


              Originally posted by shaeffer
              Hi Alex,

              Thanks for the reply. As a US equities trader, it seems to me that since the late 7.x releases eSignal has given up on trying to catch up to TradeStation (i.e. with quote list formulas, 60 minute charts that end at 4:00pm, multi-thread design, % change Y-axis in Adv charts, just to name a few absent features) so I had not seen a reason to upgrade. But not having to kick-start daily charts at the market open is an important enough improvement that I just upgraded to 10.1 (and I didn't have to copy anything over from my saved 8.0 directory, so the upgrade process is improved too).

              The only thing strange is I'm seeing yesterdays daily candle duplicated today (one hour before the open) on every daily chart. Any idea why? Hopefully this duplicate candle will change at the open.

              Regards
              Shaeffer

              Comment


              • #8
                Hi Alex,

                I opened the charts this morning and got an initial message that the program had not closed properly (don't know why), and the double candles were there. So I closed and re-opened and no more double candles. So maybe this was just an initial installation glitch, but assuming that todays candles start at the open (without the Crtl-OK kick start) then no problem

                Thanks for following up.
                Shaeffer

                P.S. I should have included in my list of things not fixed: Volume bar coloring based on last price of current bar relative to close of previous bar. Volume bar coloring should be based on the close-to-close relationship (not the open-close relationship) .. that's a charting 101 basic that shouldn't need an efs to occur.

                Sorry, I know you're not in the development group, I'm just venting. So some positives .. I like the all-in-one Edit Studies page. And the ability to both stretch and shift studies up/down is a nice fix for large volume spikes making subsequent volume bars unreadable

                Comment


                • #9
                  Shaeffer
                  You are welcome.
                  With regards to the Volume bar color IMHO that is a matter of personal preference and in my case I would rather have it based on the current bar (ie using the same logic of the bar/candles colors). Anyhow you can very easily create a simple script that paints the volume bar any way you want
                  As to clipping the spikes in the Volume bars you may want to search the forums as I wrote an efs that does that automatically
                  Alex


                  Originally posted by shaeffer
                  Hi Alex,

                  I opened the charts this morning and got an initial message that the program had not closed properly (don't know why), and the double candles were there. So I closed and re-opened and no more double candles. So maybe this was just an initial installation glitch, but assuming that todays candles start at the open (without the Crtl-OK kick start) then no problem

                  Thanks for following up.
                  Shaeffer

                  P.S. I should have included in my list of things not fixed: Volume bar coloring based on last price of current bar relative to close of previous bar. Volume bar coloring should be based on the close-to-close relationship (not the open-close relationship) .. that's a charting 101 basic that shouldn't need an efs to occur.

                  Sorry, I know you're not in the development group, I'm just venting. So some positives .. I like the all-in-one Edit Studies page. And the ability to both stretch and shift studies up/down is a nice fix for large volume spikes making subsequent volume bars unreadable

                  Comment


                  • #10
                    Anyone to answer my questions? Thanks in advance.

                    - Clearpicks

                    Comment


                    • #11
                      Originally posted by Alexis C. Montenegro
                      Shaeffer
                      You are welcome.
                      With regards to the Volume bar color IMHO that is a matter of personal preference and in my case I would rather have it based on the current bar (ie using the same logic of the bar/candles colors). Anyhow you can very easily create a simple script that paints the volume bar any way you want
                      As to clipping the spikes in the Volume bars you may want to search the forums as I wrote an efs that does that automatically
                      Alex
                      Hi Alex,
                      I agree completely that the color of volume bars is a personal preference. Your preference more readily shows if price moved up or down from the open on increased or decreased volume, which is useful information.

                      My preference though is volume color based on the close-to-close relationship, and my point is that this is also the industry standard. As 'proof' of this, the daily volume bar in the eSignal chart for QQQQ for Aug 21/08 is GREEN (close > open). But that day closed lower than the day before and four other sources (ClearStation, StockCharts.com, BarChart.com and Telechart) all show RED volume bars on that day. The day before that eSignal's volume bar coloring is again opposite the other four sources.

                      I did use the efs that changes the coloring to my preference for a while, but it is one of the efs's I've had to remove to limit my CPU usage peaking (and chart updating freezes). I assume that running any efs is an additional CPU load (compared with built-in studies that do the same thing?) so that's why I've requested many times that the industry standard be a built in choice for volume bar coloring. So though I agree that providing options for others preferences is good, I'm disappointed that the standard for volume bar coloring is still not a built-in option in 10.1

                      Regards
                      Shaeffer
                      (P.S. sorry for hi-jacking your thread here Clearpicks and taking the focus off you getting your answer)

                      Comment


                      • #12
                        Hello Clearpicks,

                        We're continuing to investigate the issue you're reporting with the Daily Bar not correctly displaying the OHLC.

                        We'd like to check the logs of your connections, if you would please PM your eSignal username we'd like to review the DM's you've connected to. Also does the issue occur only with this particular symbol or is it more wide spread (futures and equities, with and without the =1)?

                        Lastly when you launch eSignal and see the incorrect bar does the information match the Snapshot Window or OHLC of the same symbol in a Quote Window?

                        Thanks in Advance,

                        AveryH
                        eSignal Support

                        Comment


                        • #13
                          I usually displays daily charts of CL V8=1, 6E U8, $NDX, $SPX. I just did some testing according to your request. It seems most likely to have this issue with symbols such as CL V8, CL V8=1, 6E U8. However according to the result of several tests, I have not seen the problem occurs on ES U8 and NQ U8 daily charts.

                          The snapshot window and OHLC fields of quote window always show the correct daily OHLC prices of the last bar. I tried eSignal standard daily chart it always shows the last bar correctly while the advanced daily chart does not.

                          I know it might because when eSignal starts, there are quite some charts (daily and intraday) being loaded and it comsumes quite some CPU time. However since all of the snapshot, quote window and standard chart window show the correct last daily bar OHLC prices, the problem must be in the advanced chart engine itself.

                          When an advanced daily chart is loaded on my pc, it first shows daily bars up to the previous trading day. Then after some time (one or a few seconds), the current daily bar is shown. But in most cases CL V8=1 and 6E U8 show incorrect OHL prices although if I am lucky enough, they might show the last bar correctly.

                          I just PM'ed you my user name.

                          Hope all the information can help you find out the bug.


                          - Clearpicks


                          Originally posted by ahodgee
                          Hello Clearpicks,

                          We're continuing to investigate the issue you're reporting with the Daily Bar not correctly displaying the OHLC.

                          We'd like to check the logs of your connections, if you would please PM your eSignal username we'd like to review the DM's you've connected to. Also does the issue occur only with this particular symbol or is it more wide spread (futures and equities, with and without the =1)?

                          Lastly when you launch eSignal and see the incorrect bar does the information match the Snapshot Window or OHLC of the same symbol in a Quote Window?

                          Thanks in Advance,

                          AveryH
                          eSignal Support

                          Comment


                          • #14
                            standard chart of CL V8=1,D

                            the last bar is correct.
                            Attached Files

                            Comment


                            • #15
                              The daily chart of 6E U8. The snapshot window shows the correct OHLC data while the last candlestick is not correct.
                              Attached Files

                              Comment

                              Working...
                              X