 Tweet
Tweet
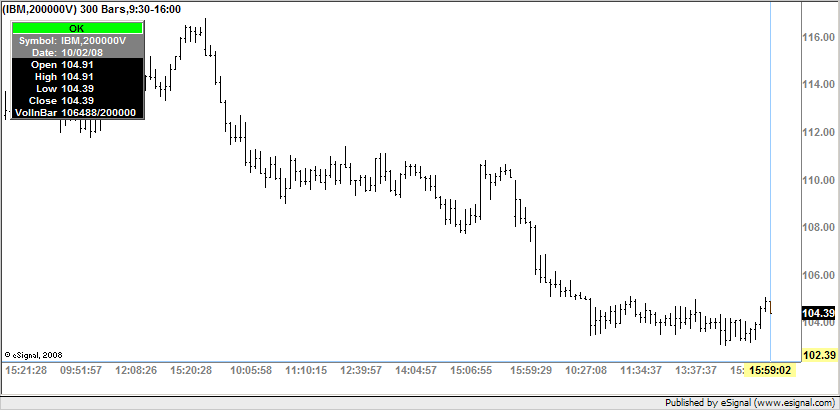
I want to set up a large volume bar chart. In 'help' it says if I set up theoretically 50000v it will produce bars above 50000v. I need a chart where the bars change at 200,000V. and for a few weeks back. How would I make that work?
THanks
raycam
THanks
raycam
Comment