Announcement

Collapse
No announcement yet.

historical $TVOLQ data

Collapse
X
 
  • Filter
  • Time
  • Show
Clear All
new posts

  • historical $TVOLQ data

    Hi,

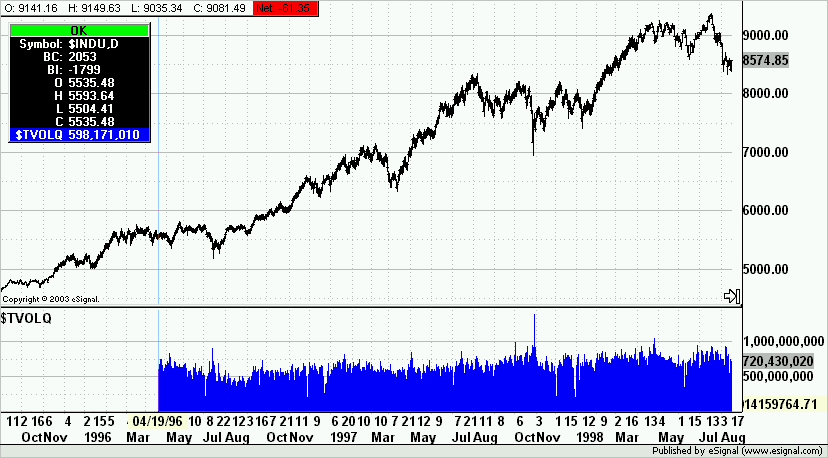
    would it be feasible to offer historical data of $TVOLQ more than 277 days?
    Say 4563 days?
    Best thing would be if you could offer volume for $COMPQ the same way it is visible in charts for stocks.

    Linus

  • #2
    Re: Reply to post 'historical $TVOLQ data'

    Linus
    As far as I can see there are approximately 1800 days of $TVOLQ daily data
    (back to May 96)
    Alex

    Comment


    • #3
      Hi Alexis,

      I used the code you once provided here in this board:
      PHP Code:
      //    This formula was created by Alexis C. Montenegro

      function preMain() {
          
      setCursorLabelName("$TVOLQ");
          
      setStudyTitle("$TVOLQ");
          
      setPlotType(PLOTTYPE_HISTOGRAM);
          }

      function 
      main(Sym) {
          var 
      vSym "$TVOLQ";
          if (
      Sym == nullSym vSym;
          
      var 
      vSymbol getValue("Close"0, -1Sym);

      return 
      vSymbol;

      It works well. However after 277 bars it stops plotting it.
      Would be really fine if could see the histogram back to May 96.

      Linus
      Attached Files

      Comment


      • #4
        Linus
        How much data you will see depends on the Time Template.
        In the following chart running the efs you just posted the Time Template is set to load just over 2500 days and as you can see $TVOLQ goes back to 4/19/96 that corresponds to 1799 bars back (see date at the cursor and Bar Index (BI) in the Cursor Window)
        Alex

        Comment


        • #5
          Alex,
          now would you please help me:
          I used the Equity RTH - East Coast time template.
          #days was set to dynamic mode.
          The chart showed prices of $COMPQ back to 1985.
          I've typed 1800 and clicked update/add.
          Right-clicked on the chart and reloaded $TVOLQ.
          Nothing changed.
          Can you tell me how to set up the time template?
          Linus
          Attached Files

          Comment


          • #6
            Linus
            What you set to 1800 Days is the Intraday Default only.
            As there is no specific setting for Daily interval then the Template will switch to Dynamic (ie enough bars to fill in the screen) when that interval is loaded.
            Here is what you need to do to load a specific number of days.
            Notice in the TT that the User Defined interval D (for Daily) is set to 2000 Days
            Alex

            Last edited by ACM; 07-03-2003, 10:32 AM.

            Comment


            • #7
              still need to enhance data feeds

              Alex,

              as for the $COMPQ/$TVOLQ, thank you so much!

              You said the user defined interval goes up to 2000 days/bars.
              However it plots over 3430 days/bars back to October 1989.
              In the dynamic mode I could see bars back to January 1985.
              Actually I'd really love to see data back from the very start in 1971.

              I see still need to enhance the data feed to get dynamic mode and user defined in sync. And I wonder why it is so hard to provide customers with these kind of historical data.
              At the Nasdaq Market Data web http://www.marketdata.nasdaq.com/mr4b.html you can download daily data in spreadsheet format from 1971 till today.
              I'm aware that most users rather like intraday data of 1000 days for backtesting purposes. To me this seems like counting ants on a hill.

              What about adding this feature:
              Basic or Advanced Charts could get data from a user defined source like MS Excell.

              Linus

              Comment


              • #8
                Linus

                You said the user defined interval goes up to 2000 days/bars

                I did not say that. I just loaded that number of days as an example, but you can load more than that.

                However it plots over 3430 days/bars back to October 1989.
                In the dynamic mode I could see bars back to January 1985.


                Set a higher number in the Time Template. On average there should be in excess of 10 years of Daily data.

                I'm aware that most users rather like intraday data of 1000 days for backtesting purposes. To me this seems like counting ants on a hill

                Different strokes for different folks. It all depends on the strategies you use. If you were trading 1 minute charts that is what you would want to test too.

                Alex
                Last edited by ACM; 07-03-2003, 11:07 AM.

                Comment

                Working...
                X