Announcement

Collapse
No announcement yet.

Esignal and Forex charts

Collapse
X
 
  • Filter
  • Time
  • Show
Clear All
new posts

  • Esignal and Forex charts

    I am a new subscriber to Esignal and try to work my way through all these overwhelming options.
    I apologize already for the rather lenghty post, but although I am not new to computers and have worked with many different softwares, I feel a bit lost in the moment. So please bear with me.
    It seems I am stuck right at the beginnig already.
    I have planned to use Esignal for Forex studies strictly, which means I wanted to study the market in real time during the day and after US market close (altough I know it is a 24 hours market of course) I wanted to study certain currency pairs more indepth for a medium time frame perspective.
    But I cannot get the Forex charts to open. What do I need to do to have all currency pairs listed and open the according charts to do my studies?
    I have subscribed to real time data, but today Saturday, the market is closed, so I wanted to open some EOD Forex charts, to prepare me for next week's market open, but again, I cannot open one Forex chart.
    When I click the Layout button, there is a Forex option, a few symbols pop up, but no data stands right next to them.
    I have another charting service for Forex and here I can go back months and years, even if the market is not open. Isn't there a similar way in Esignal?
    PLEASE help!
  • #2
    Tekunda
    When you subscribed did you also specifically add Forex to your subscription?
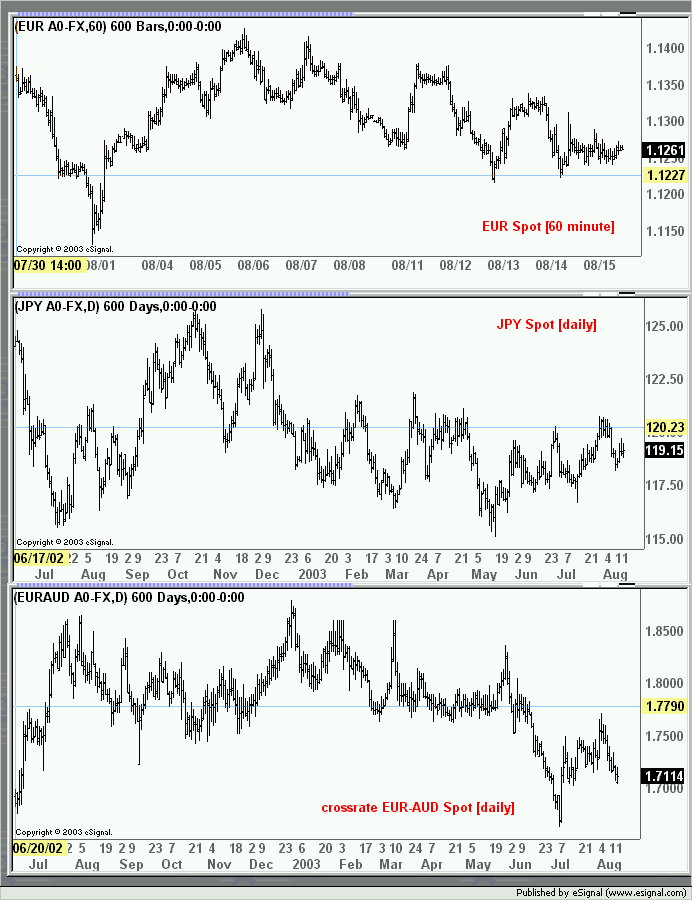
    If you did what crossrates are you trying to plot because as far as I can see here almost everything I tried seems to be charting without any problems be it intraday or daily (see attached samples)
    Alex

    Comment


    • #3
      Yes, I have subscribed to Forex and it seemd that Esignal had a little server problem, as I have now opened the charts again, and suddenly I got all data.
      My charts look a bit different, but that is the persoanl setup I assume.
      Ok, now I am a step further. But how do I start my studies now?
      When I subscribed, I was told by the Esignal rep that right clicking into the chart would bring up the Advanced Get studies.
      Well, not in my case! It only brings up a draw trendline menue.
      The AdvancedGet studies were the reason why I signe up in the first place. Any idea how to start the studies?
      If I click an advanced chart a default IBM stock will open and here I can choose the AdvancedGet. But if I clikc the Forex layout and open a chart there, I cannot. Also no studies in the main menu to find. I am certainly lost here.

      Comment


      • #4
        Tekunda
        There are two types of charts in eSignal namely Charts and Advanced Charts. The one that shows Draw Trendline when you right click the chart is a standard Chart.
        I have not looked at the Forex Layouts but I presume they are composed primarily of standard Charts rather than Advanced Charts which is why the AdvancedGET studies - which can be applied only to an Advanced Chart - do not appear.
        May I suggest that you perhaps spend some time going through the eSignal Online Manual, the eSignal FAQs and also maybe viewing some of the videos at eSignal University (all underlined words are links).
        You will find that most of the information is contained there.
        Alex

        Comment


        • #5
          Alex,

          before I posted my first post, I went through quite a few of the files you suggested. I know it looks like I have not read the manual at all, but this is not so.
          You are right with your assumption: It is a standard chart, which opens.
          The problem is though, that I cannot get the advanced chart to work. I click new, (layout is Forex layout, all data is fine) and when I click advanced chart, a IBM stock chart pops up and not the EUR Forex chart, which pops up when choosing the standard chart button.
          I cannot get the program to open a Forex chart in the advanced mode. It only opens the Forex charts in standard mode. This drives me nuts, as I have not altered the default setup of the program.
          So if you have one more tip for me how to get this program to open the same chart I use in standard mode, also in advanced mode, I would be grateful.

          Comment


          • #6
            Tekunda
            No problem. The Advanced Chart opens with IBM as the symbol only because it is set by default to do so. In time you can change all the defaults as you get more acquainted with the application.
            Anyhow, select the Advanced Chart that shows IBM and simply start typing the symbol you want. As you do so a Symbol dialog box will appear with the symbol box partially filled. Complete typing the symbol, type an interval if different than what is showing and click OK or press <Enter>.
            The Advanced Chart should now plot your Forex symbol.
            If you want you could now add this chart to the Layout by first saving the chart itself and then saving the Layout.
            Hope this helps
            Alex

            Comment

            Working...
            X