Announcement

Collapse
No announcement yet.

Charting question-Stochastic overlays

Collapse
X
 
  • Filter
  • Time
  • Show
Clear All
new posts

  • Charting question-Stochastic overlays

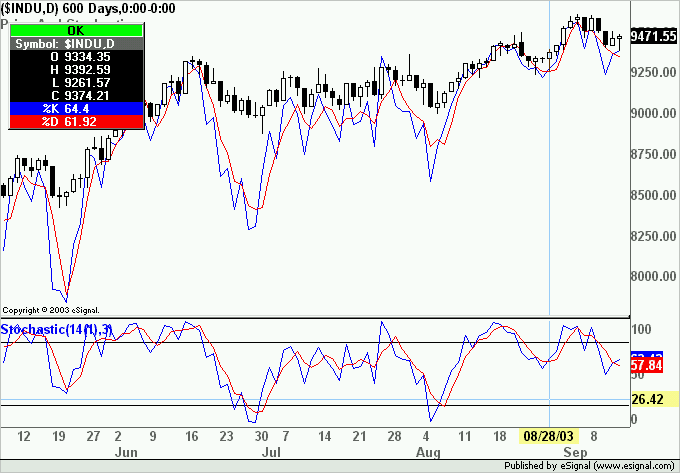
    This message is for one of the E-Signal moderators. I am a new E-Signal subscriber and love your system. I have one question that hopefully you can answer. In a candlestick chart (I trade the S&P E-mini futures only), I use a slow stochastic indicator. When setting this indicator up, it sets it up in its own window pane below the candlestick chart. Is there anyway to overlay this stochastic on top of the candlestick chart ??? I was a former Real Tick subscriber and you can do it on their charting system as well as Neo-Ticker system. A respone would be greatly appreciated
    Thanx, Paul W.

  • #2
    Paul
    I am not with eSignal but am one of the moderators so I will take the liberty of replying to your message.

    Is there anyway to overlay this stochastic on top of the candlestick chart?
    Yes, the Stochastic can be plotted in the price pane when programmed as an efs as you can see in the image below (Stochastic is also shown in its own window for comparison purpose).


    You can find this efs by clicking here
    Alex
    Last edited by ACM; 09-14-2003, 03:32 AM.

    Comment


    • #3
      Paul
      in the next version 7.5 due to be released in the near future as beta you will be able to overlay studies in the price pane without the need of a specifically programmed efs.
      To see more on this feature click here
      Alex

      Comment

      Working...
      X