 Tweet
Tweet
Hello,
I have some serious problems with line charts in Esignal!!!
Look at the following:
http://finance.yahoo.com/q/bc?s=^GSPC&t=1d
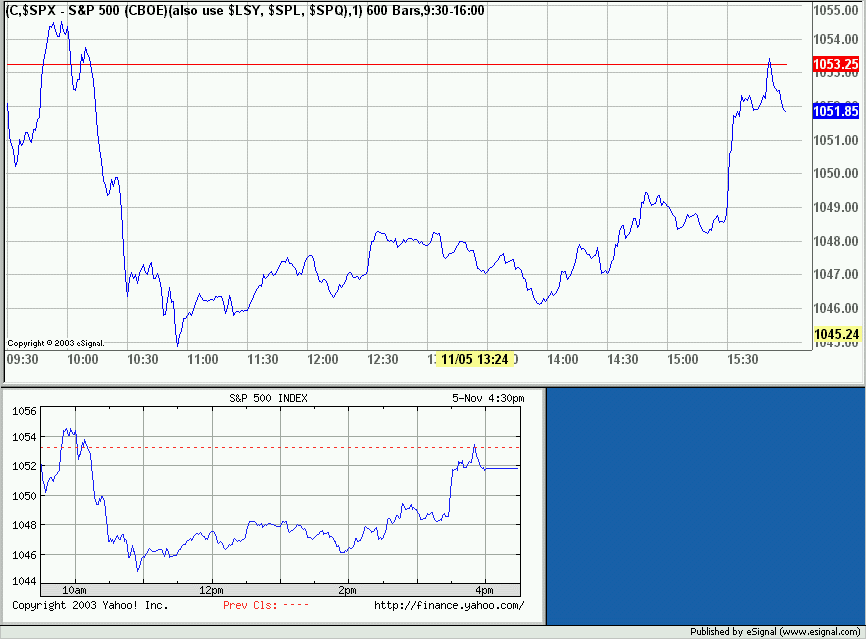
This is a line chart from yahoo finance. I try to set up a similar line chart in esignal but without success.
The problem is the following: Every time I chose an advanced line chart (intraday) for, let's say, the S&P 500 index, I get a very choppy, condensed chart which shows at most 20 ups and downs in price change within the first 2 hours trading. I use a 1-minute chart.
I think the problem here is that in line charts Esignal only draws price changes every minute or so, whereas even yahoo finance seems to draw new lines every couple seconds or when price changes occur. What can I do about it?
This is very bothersome and so far the line charts in Esignal are a real drawback.
(I know and I use bar and candlesticks for most of my analysis, however, I also need a decent line chart). Can this be accomplished through EFS or the like? Please, any help in this regard is much appreciated.
Thanks,
Matt
I have some serious problems with line charts in Esignal!!!
Look at the following:
http://finance.yahoo.com/q/bc?s=^GSPC&t=1d
This is a line chart from yahoo finance. I try to set up a similar line chart in esignal but without success.
The problem is the following: Every time I chose an advanced line chart (intraday) for, let's say, the S&P 500 index, I get a very choppy, condensed chart which shows at most 20 ups and downs in price change within the first 2 hours trading. I use a 1-minute chart.
I think the problem here is that in line charts Esignal only draws price changes every minute or so, whereas even yahoo finance seems to draw new lines every couple seconds or when price changes occur. What can I do about it?
This is very bothersome and so far the line charts in Esignal are a real drawback.
(I know and I use bar and candlesticks for most of my analysis, however, I also need a decent line chart). Can this be accomplished through EFS or the like? Please, any help in this regard is much appreciated.
Thanks,
Matt
Comment