Announcement

Collapse
No announcement yet.

addBand problems

Collapse
X
 
  • Filter
  • Time
  • Show
Clear All
new posts

  • addBand problems

    I was using eSignal 7.5RC and am now using 7.5 Gold.

    When I add wide bands to an advanced chart I have trouble with a few things:

    - Setting the exact size I want (sometimes 100 is the right size and other times it's 225)

    - The size of the band varies by what part of the chart I am viewing ( See attached chart) and the vertical size of the chart.

    - When I scroll the chart vertically to view a higher or lower part of the chart the band stops at the mid-point of the band. I can keep scrolling up or down but half of the band is always showing.

    - Lines that I draw on the chart are behind the band unless I change the chart properties to Draw Lines On Top of Price.

    Is there anything I can do to set the band size more accurately
    and permanently?

    Dale Sullivan
    Attached Files

  • #2
    Hi,

    First, if I understand correctly you are trying to draw bands with and EFS. You might get more/better replies if you go to the EFS group to post this.

    - Setting the exact size I want (sometimes 100 is the right size and other times it's 225)
    Without knowing what exactly you are trying to do, it is hard to comment on this. I might suggest that addband isn't the right tool for you, since my guess is you want to dynamically resize the size of the bands depending on certain parameters. I think we could help you better if we better understood exactly what you are trying to do.

    - Lines that I draw on the chart are behind the band unless I change the chart properties to Draw Lines On Top of Price.
    Yes, this would be the way most people would want bands to behave...from what I think I see you are trying to do with them you are not using them as they were intended to be used. But again, if I had a better idea of what you were really trying to accomplish I might be able to better help.

    Garth
    Garth

    Comment


    • #3
      Dale
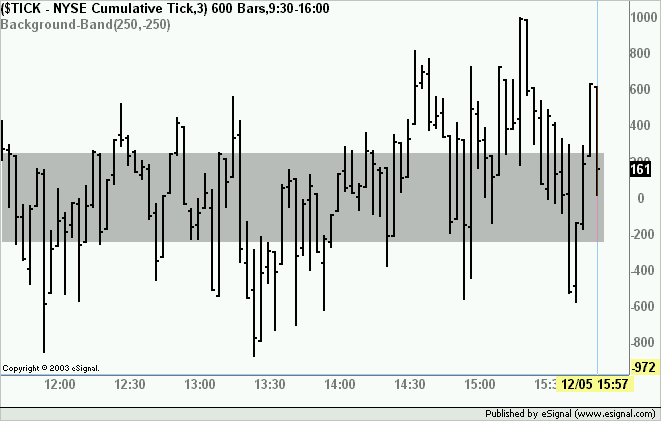
      An alternative solution could be to use the setBarBgColor() with limits for high and low as shown in attached sample efs.
      You would still need to check Draw Lines On Top of Price in the Properties menu to plot the Line Tools on top of the background color.
      Alex


      PHP Code:
      function preMain(){
      setPriceStudy(true); 
      setStudyTitle("Background-Band"); 
      setShowCursorLabel(false); 


          var 
      fp1 = new FunctionParameter("Upper"FunctionParameter.NUMBER);
          
      fp1.setDefault(250);
          
          var 
      fp2 = new FunctionParameter("Lower"FunctionParameter.NUMBER);
          
      fp2.setDefault(-250);

      }

      function 
      main(Upper,Lower){

      if (
      1==1
      setBarBgColor(Color.lightgrey,0,Lower,Upper);

      return 
      null;

      Comment


      • #4
        Thanks for your replies to my dilemma Garth and Alex. I tried posting my problem in the efs section first but didn't get a reply (and still haven't) so I thought I might have posted it in the wrong section. The message that reported the release of the new 7.5 version said to post problems here.

        I guess I got bit too general when I tried to explain my problem the first time. I hope I don't get carried away to the opposite extreme this time ;-)

        I am trying to use bands to display a range of prices on an advanced $TICK chart. I wanted to use light grey for middle range +500 to -500 and use a red band for anything below -500. I was going to use -500 to -1500 to cover an extreme price movement.

        My first problem occurred when I tried set the thickness of the grey band. It seems to me that to cover +500 to -500 the thickness should be 1000, but that is not the case. I had to play around with the thickness parameter to get it near the range I wanted to cover.

        When I added the red band I had even more trouble. I had to play around with both the dValue and thickness parameters to get the band to start covering at -500. However, the lower range of the band didn't come anywhere near -1500. Then I started moving the chart back in time and noticed that the red band changed the range it covered. I also tried moving the chart up and down and saw that half of the bands are always visible, no matter how far up or down you move the chart (see the picture I included with this message.)

        Am I trying to use the addBand function in a way that it wasn't meant to be used? For a long time I have been using addBand to create lines on prices and indicators (for example: zero, 20 and 80 in Stochastics) and never had any trouble with it until now when I tried to make some bands noticeably wider on a chart that varies in size.

        I just tried using the efs that Alex suggested and it works the way I expect the addBand function to work. The values you use to specify the range make sense and the range stays at the same prices no matter how you manipulate the chart. The only drawback I can see to this method of drawing the band is that you can only create one band. In my case that is not a big problem. I can live with only one band. I don't need anything especially fancy.

        Thanks for your help, guys.

        Dale Sullivan


        PHP Code:
        var vZeroLine 0

        addBand
        (0PS_SOLID190Color.lightgrey"MidBand");
        addBandvZeroLinePS_SOLID10Color.grey"ZeroLine");
        //addBand(-875, PS_SOLID, 150, Color.red, "LowBand");

        function preMain() {

            
        setPriceStudy(true);
            
        setStudyTitle("My_BG_ColorBand_TEST");

        }

        function 
        main() {


        Attached Files

        Comment


        • #5
          Dale
          You may want to check this thread
          Alex

          Comment


          • #6
            Thanks Alex. That thread showed me an idea for a workaround that I didn't even consider as being possible. I modified your example code below to add a color parameter. Then all I had to do was load 2 copies of the same efs and edit the study parameters of the second copy for the range and color for the 2nd band.

            I set the range of the 2nd bar to -250 and -1500, and the color to red. I noticed, however, that there is a white line between the 2 bands. You have to overlap the -250 parameter values a little to get rid of the white line, but that's just being nitpicky ;-)

            Dale

            PHP Code:

            function preMain(){
            setPriceStudy(true); 
            setStudyTitle("Background-Band"); 
            setShowCursorLabel(false); 


                var 
            fp1 = new FunctionParameter("Upper"FunctionParameter.NUMBER);
                
            fp1.setDefault(250);
                
                var 
            fp2 = new FunctionParameter("Lower"FunctionParameter.NUMBER);
                
            fp2.setDefault(-250);
                
                var 
            fp3 = new FunctionParameter("vColor"FunctionParameter.COLOR);
                
            fp3.setDefault(Color.lightgrey);

            }

            function 
            main(Upper,Lower,vColor){

            if (
            1==1
            setBarBgColor(vColor,0,Lower,Upper);

            return 
            null;

            Comment

            Working...
            X