Announcement

Collapse
No announcement yet.

problem w/ 13 minute chart / time template

Collapse
X
 
  • Filter
  • Time
  • Show
Clear All
new posts

  • problem w/ 13 minute chart / time template

    Hello,

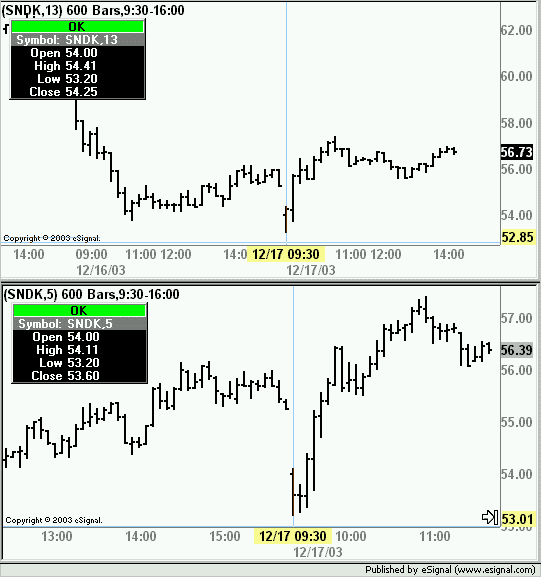
    I have noticed that when I use a 13 minute chart (advanced chart) the first 13 minute candle does not "start" / appear until 9:33 a.m.

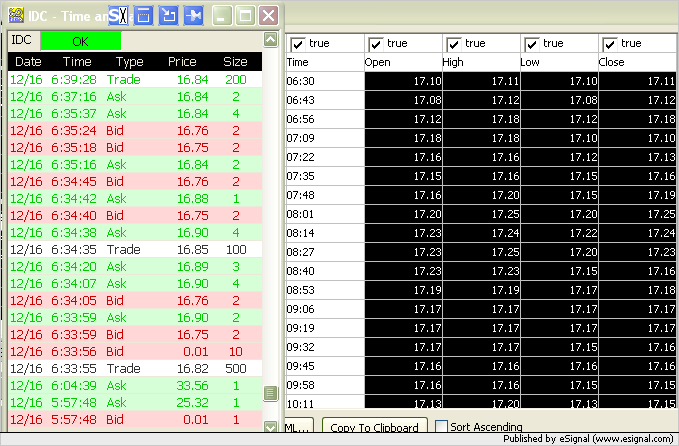
    I have tried different time intervals like Equity RTH East Coast as well as 24 hour with time set at 9:30 to 16:00. And if you check, you will notice the "open" price for that candle is NOT the "open price" for the stock or on equal to the open price on the 1 and 3 minute charts (9:30 open price).

    How do I get the 13 minute chart to START at 9:30 and NOT 9:33?

    thanks in advance.
    LW212
    [email protected]

  • #2
    LW212,

    If you look at the time of the bar, it will likely show 9:30. It should be performing correctly. There may just be a misunderstanding. Please look at the below screenshot of IDC. You'll notice that the first trade didn't start until 6:33 (Pacific Time,) but the chart started at 6:30 as expected. This effect is caused by the NYSE not opening all stations at the same time. On the bigger issues, they'll open right at 6:30, but on others it can be later. More likely than not, the symbol you're seeing not opening at the expected time is also experiencing this effect. If I'm off-base on this, please feel free to let me know.

    Regards,
    Jay F.
    Product Manager
    _____________________________________
    Have a suggestion to improve our products?
    Click Support --> Request a Feature in eSignal 11

    Comment


    • #3
      13 min chart / time template

      Thanks for responding... No the problem is NOT that the stock in question does not actually trade before 9:33 ... This 13 min chart problem occurs on every one of my Nasdaq stocks that I have pulled up...like EBAY, KLAC, QLGC, SNDK, etc... so these stocks Definitely have trades going off at 9:30 (most of the time several trades premarket). The problem lies in that the while the 1 and 3 min charts are producing candles and 9:30, :31, :32...the first candle on the 13 min chart does NOT appear until 9:33 ...

      I have temporarily fixed this by adding and setting a 24 hour time template to start at 9:27 and end at 16:00. And I only used this time setting on the 13 min charts. Today the first candle started right at 9:30.

      Do you see the problem? something is amuck if I have to set it back 3 mins.

      if I am not clear let me know and I will try to explain another way or in more detail.

      Thanks,
      LW212

      Comment


      • #4
        Re: Reply to post 'problem w/ 13 minute chart / time template'

        I have a question about this issue.

        I just brought up a 13 min KLAC, and it starts at 930.

        Is this something you see at the open, then it clears up if the chart is
        reloaded later in the day?

        How can you tell the chart started at 933? Probably watching it at 931,
        932, etc, huh?

        ----- Original Message -----
        From: <[email protected]>
        To: <[email protected]>
        Sent: Tuesday, December 16, 2003 4:16 PM
        Subject: Reply to post 'problem w/ 13 minute chart / time template'


        > Hello dloomis,
        >
        > ~~~~~~~~~~~~~~~~~~~~~~~~~~~~
        >

        Comment


        • #5
          13 min chart still off

          Ok, got to make this quick b/c in midst of trading...

          There is still a problem with the 13 min chart even if I change the time template setting to start at 9:27 and the first candle starts at 9:30 ... The problem with this "fix" is that the following 13 min candle starts at 9:40 and not 9:43

          Now as far as KLAC and any other naz stocks ... the 13 min chart with time settings for 9:30 will say that the first candle/bar is 9:30 HOWEVER, I am watching these and the actual Candle/bar does NOT start forming until 9:33 ... just compare the Open price of your first 13 min candle to the open price of the stock or your first 1 min candle at 9:30 ... They do NOT match up ... A great example today is SNDK ... check it out

          Please someone help me with this matter.
          Thank you.
          LW212

          Comment


          • #6
            A workaround may be to extend your idea of starting 3 minutes early to 13 minutes earlier. That way your subsequent bars will line up the way you want. Short of knowing why you are seeing this phenomena, this may work for you.

            Comment


            • #7
              13 min char issue .... nice idea but will not work

              Thanks for the idea about 13 mins earlier.

              However, I want my first candle to appear at exactly 9:30 on the chart and for the open price to match that on other charts with different time frames.

              I don't want to an earlier starting time b/c it changes the other "idicators", like the stochastics, and such.

              This should not be a problem.

              Are you able to pull up a 13 min chart on SNDK today and your opening price on the first bar/candle matches what the other charts like 1, 3, 5 say ?

              If so please tell me which time template you are using. Thanks
              LW212

              Comment


              • #8
                I'll check out this afternoon and let you know what I come up with

                Comment


                • #9
                  LW212
                  FWIW this is what I am seeing on 13 and 5 min charts for SNDK
                  Time Template is set to 9:30-16:00 ET
                  Alex

                  Comment


                  • #10
                    Alexis...thanks ... almost there

                    Thanks Alexis for posting those charts...that is what i have also.

                    However, if you will check the Snapshot Window AND the Open price in the top of your Level 2 (marketdepth) box the OPEN price for SNDK was listed as $54.11 NOT $54.00 ... so which one is it?

                    AND tomorrow if you leave your 13 min chart open, it will NOT start to form the actual bar/candle until 9:33 ...

                    Why is this?

                    I have spoken to esignal tech support and they didn't really have an answer.

                    I mistakenly thought the 1, 3, 5 etc were different in open price of the 13 min ... I had set my template today to 9:27 so the bar/candle would start forming at 9:30 (which it did) ... but I got a price of 9:27 ... now that I have reset the 13 min back to 9:30 they are the same as other interval charts (so my error) ...

                    However, that still leaves the snapshot window and the Level 2 box off with Different OPEN prices.

                    Thanks for everyone's help on this. I GREATLY appreciate it!!! You guys posting on here has "converted" me to stay with esignal and leave qcharts :-)

                    LW212

                    Comment


                    • #11
                      This morning, I was able to duplicate this. Just as LW212 described the 13 minute chart did not update until 6:33, but other intervals updated fine. I'll definitely let our QA Team know about this one. It's certainly a strange one!

                      FYI, as an aside, I also tried this with Tick Replay and it worked fine. I don't think the bug is in the Advanced Charts, but somewhere else.
                      Regards,
                      Jay F.
                      Product Manager
                      _____________________________________
                      Have a suggestion to improve our products?
                      Click Support --> Request a Feature in eSignal 11

                      Comment

                      Working...
                      X