Announcement

Collapse
No announcement yet.

Prior days chart of a particular multiple symbol incorrect

Collapse
X
 
  • Filter
  • Time
  • Show
Clear All
new posts

  • Prior days chart of a particular multiple symbol incorrect

    If I plot $AIFVG4 on an advanced chart as one of multiple symbols, the intraday data for many of the days prior to the current one is plotted incorrectly. This happens again each day with the previous days data being added to the data that is plotted incorrectly. When $AIFVG4 is the chart symbol itself, it's shown correctly however.

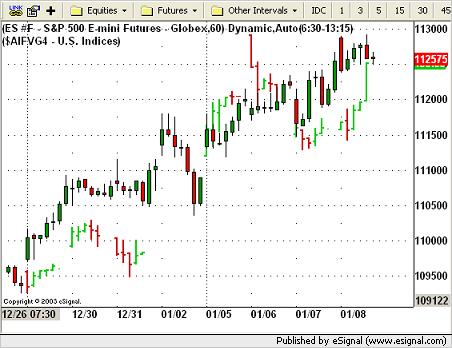
    As an example, look at a dynamic 60-minute, 9:30-4:15 chart of ES #F with the close of $AIFVG4 plotted as the 2nd symbol. It was working fine until about 12/24/03. From then on, though, you'll see it the close as a upward sloping line, with no wiggles at all. The problem occurs for $AIFVF4, for example, also.

    I tried to attach a file to this post to show it, but the attach function fails for some reason. The attach process ends up not doing anything, basically acting as if I didn't try to attach anything at all. Perhaps that has something to do with my firewall or security setttings. But despite my not posting the graphic, you should easily be able to reproduce the problem.
    Last edited by tbodnar; 01-08-2004, 11:34 AM.
    Tom

  • #2
    Perhaps the problem is that eSignal is now failing to save the prior day's data for the AI Fair Value symbols, as it had been doing up until 12/24. Charts of those symbols show the current day's data, but then a BIG GAP going back to 12/24/03.
    Tom

    Comment


    • #3
      Hi Tom,

      I'm not familiar with the symbols that make up the data for AI Fair Value, could you post some of those that I may check?

      Below is a chart showing the two symbols. I do see where there is missing data on $AIFVG4 from 10:30am pst on 12/31 thru 6:30am pst on 1/5. Is this also what you see? I'll check with our QA on the status of that.

      Candle is ES, Bar chart is $AIFVG4


      On another note, for information on how to post an image, please visit this post.

      Regards,
      Andy

      Comment


      • #4
        Please try choosing a line chart with just the close plotted. That's what I am doing when I see what I reported.

        As to the components of that index: the AIG Commodity Index is made up of 20 commodities, very much like the CRB, but with a different balance. It includes wheat, copper, crude, etc.

        Also, I did exactly that attach process. What happens is that I then go to preview the post and find NO attachment there. Yet no error occurred. I tried it several times and got the same result. I am even sure of the file name I tried to attach, since I located it on my hard drive through "browse."

        I am seeing a bad plot of the data ever since after 12/24. The market was closed around the holidays so data missing from those days is expected. The data that is displayed IN THE CURSOR WINDOW looks okay; it's just the plot of the close of that additional symbol that's wrong. And today's data - which looks fine intraday - will be part of the continued "straight line" I see for the line plot of close values when I log on tomorrow.
        Tom

        Comment


        • #5
          I could e-mail the chart to someone if necessary.
          Tom

          Comment


          • #6
            Here is the problem posted to the file share section

            http://share.esignal.com/groupconten...png&groupid=14
            Tom

            Comment


            • #7
              Did someone fix something?

              After days of being wrong, the charts are CORRECT today. Hopefully they'll stay that way. Was something corrected or is it unknown why this was occurring?
              Tom

              Comment


              • #8
                Tom,

                It appears this symbol is affected by the Boxing Day bug mentioned in this thread. Because it is being overlaid on a symbol that is not affected, it was appearing very strangely. The problem went away, because you are on one of the few servers that was upgraded with a fix (albeit that fix has other problems mentioned in this announcement.)
                Regards,
                Jay F.
                Product Manager
                _____________________________________
                Have a suggestion to improve our products?
                Click Support --> Request a Feature in eSignal 11

                Comment


                • #9
                  That's a convincing explanation. The DJ-AIG Commodity index does contain NYBOT Cocoa, Coffee and Sugar futures.
                  Tom

                  Comment

                  Working...
                  X