 Tweet
Tweet
Hello,
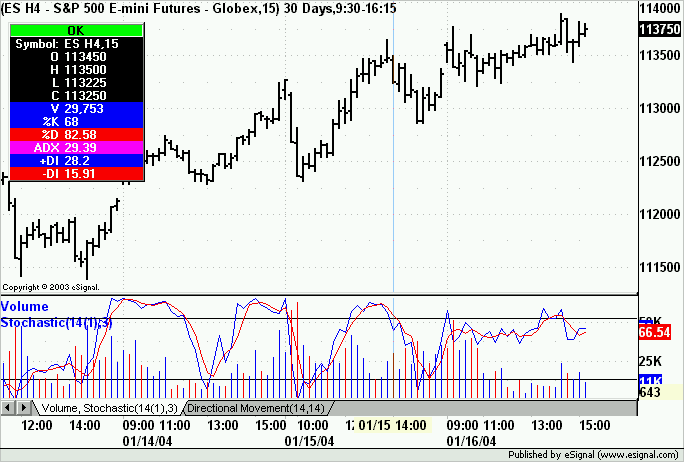
I have a few different studies in each Advanced Chart window. For most of these studies, I don't care to see the graphics (i.e., line or histogram or whatever). All I need to see is the value in the cursor window. Up until now, I've always stacked the studies, keeping volume on top. This suited my purposes well, as I had only two things on the chart: price and volume. At the same time, though, I could see the current value for the other studies in the cursor window.
Now I would like to see the graphics of two studies at the same time (volume plus one other indicator). But if I click "Tile Studies", I get pictures of all of them. I can squish the ones I don't want until they're very small, but it still takes up valuable real estate on my screen.
Is there any way to simultaneously see only 2 studies graphically and keep values for the other studies in the cursor window without seeing the graphics for them? I've considered the possibility of putting volume in the same "pane" as the price and then stacking the other studies. This wouldn't be ideal but it would be an improvement. I haven't figured out how to do this either though.
Thanks for any help!
Jason

Comment