Announcement

Collapse
No announcement yet.

ES/NQ Day Session Charts with Volume?

Collapse
X
 
  • Filter
  • Time
  • Show
Clear All
new posts

  • ES/NQ Day Session Charts with Volume?

    I am a new esignal user trying to set up day session ES and NQ charts with volume. When I set the symbols with =2 for day sessions volume bars disappear from the charts. How would I go about setting up this type of chart correctly?

    I am using v7.4 with esignal at Lind.

    Thanks for your help with this.

    Spinner
  • #2
    Spinner
    I suppose you are referring to Daily (or higher) charts as the Volume should be available for intraday charts also with the =2 symbols.
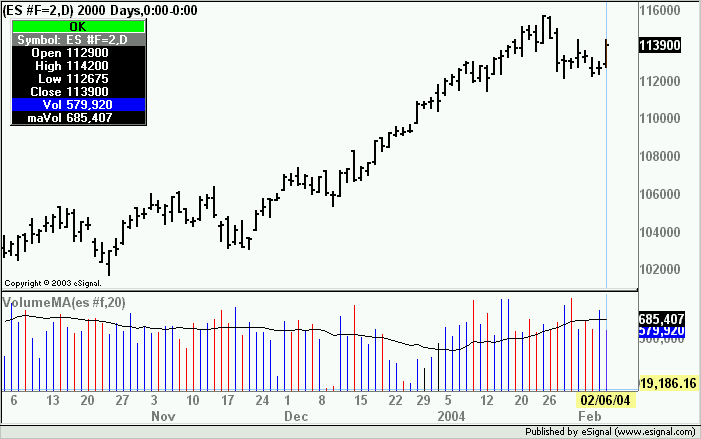
    Anyhow Volume for Daily is not available with =2 symbols and the workaround is to retrieve the Volume of the regular symbol through an efs such as the one attached.
    Run it on the chart for ES/NQ =2 and initially it will not plot any Volume. Right click the study select Edit Studies and in the symbol box type ES H4 or NQ H4 (or their continuous equivalents)
    The efs also plots an MA of Volume.
    Hope this helps
    Alex

    Attached Files

    Comment


    • #3
      Alex
      Thank you! And yes, I was referring to Daily and higher charts. This efs worked fine.
      Thanks for your quick response,
      Spinner

      Comment


      • #4
        Received via PM from another user

        The color of the volume bars is not the same as the one in Basic Studies Volume

        It depends how the Basic Studies Volume is set up. The efs posted earlier uses Close higher/lower than prior Close to determine the color of the Volume bar.
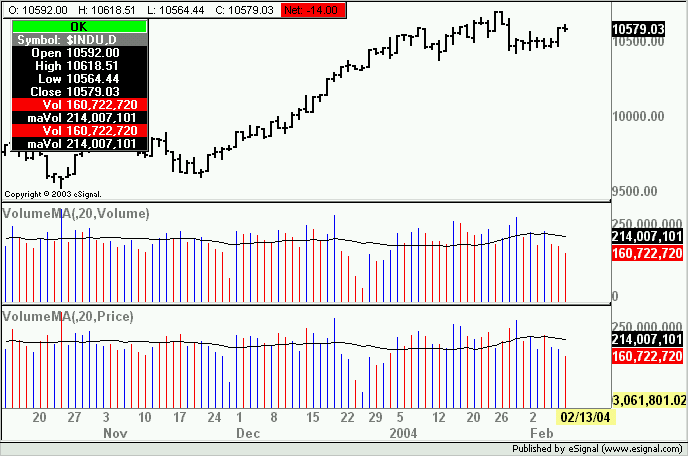
        I have revised that efs and it now includes an option to color the Volume bars either on Close being higher or lower than the prior or the Volume being higher or lower than the prior (the image below shows both settings). The default is set to Volume but can be changed through Edit Studies.
        Alex

        Attached Files

        Comment

        Working...
        X