Announcement

Collapse
No announcement yet.

Advanced Chart Scaling

Collapse
X
 
  • Filter
  • Time
  • Show
Clear All
new posts

  • Advanced Chart Scaling

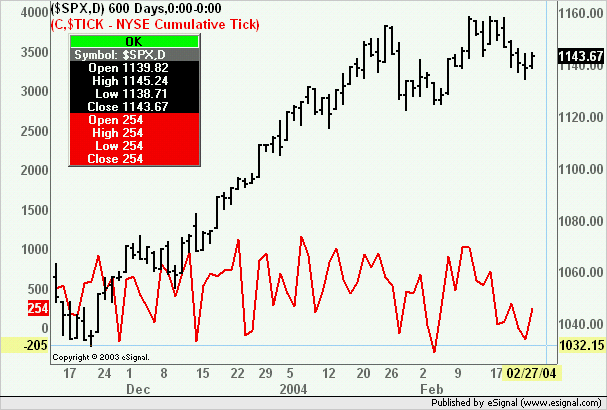
    I have been working with some of the study and multiple symbol overlays and have been trying to change the scaling and position of the overlay. Is there a way to adjust the position of the overlayed symbol (I put its scale on the left axis) in its vertical orientation (up or down in the window)? I was able to do this once accidentally but haven't been able to repeat it.

    Thank you.

  • #2
    Hi buhrmaster,

    This is possible. Once the both symbols are on the chart, right click the chart window and choose "Edit Studies". Choose the symbol to be scaled and choose "Display Left" and "Scale Left" options in the lower left hand corner of the menu. This will allow you to vertically scale the overlaid symbol.


    I hope this helps.

    Comment


    • #3
      I replicated the chart you posted and tried to adjust the position of the two stocks relative to each other (left mouse down in the window and moving up and down). The result was that both stocks moved up and down the window at different rates and by changing the scales on either side was able to get them in the position I want (sort of). Apparently what I cannot do is control the position of each stock independently.

      I was trying to overlay $TICK over $SPX and in that case $TICK does not budge from the center position on the screen and only $SPX moves up and down. What I want is to have the $TICK in the lower part of the screen and $SPX in the upper part. Is this possible? What would really be nice to have is to control scale and position of the overlay independently of the first symbol.

      Thanks.

      Comment


      • #4
        Hi buhrmaster,

        Are you running eSignal version 7.5? This is important, as left scale feature was not available in earlier versions. I've enclosed a screenshot of the chart where I tried to replicate your attempts. Is this accurate?

        Comment


        • #5
          Yes, I am running 7.5.

          Notice on your chart how TICK is centered vertically in the frame -- I can't figure out how to shift it to the bottom of the frame. All I can do is change the dispersion of the values on the left axis.

          Again, quite by accident, I believe I had at one time control over the positioning of the overlay item on the left axis but can't recollect the keystroke combo that got me there!

          Comment


          • #6
            Buhrmaster,

            I think I see what you are referring to. The overlay feature does have free floating ability, but it only extends to the primary symbol on the chart. The overlayed symbol has a fairly static axis. The primary symbol can be shifted to higher and lower positions on the chart but due to this functionality, the secondary symbol will remain centered within the chart window. I'm not aware of any hotkeys that will unlock the secondary symbol free floating capability. If anyone has information to the contrary, please feel free to post.

            Comment


            • #7
              Buhrmaster, Duane
              You may want to try the following.
              Open a new chart and load the overlay symbol. Switch the Scale and Display for the overlayed symbol to the left. Then make sure that AutoScale only is enabled and compress the left Y-axis. At this point drag the chart downwards (it may take a lot of drags to get the overlayed plot to the bottom of the chart). In the process make sure you do not touch the right Y-axis otherwise the control switches over to that scale. Until then the primary symbol will be auto-scaled and the overlay will remain at the bottom.
              Alex

              Comment

              Working...
              X