Announcement

Collapse
No announcement yet.

Advanced Charting Stochastics ...

Collapse
X
 
  • Filter
  • Time
  • Show
Clear All
new posts

  • Advanced Charting Stochastics ...

    I emailed tech support with this question and they said to ask it here.

    So here goes:
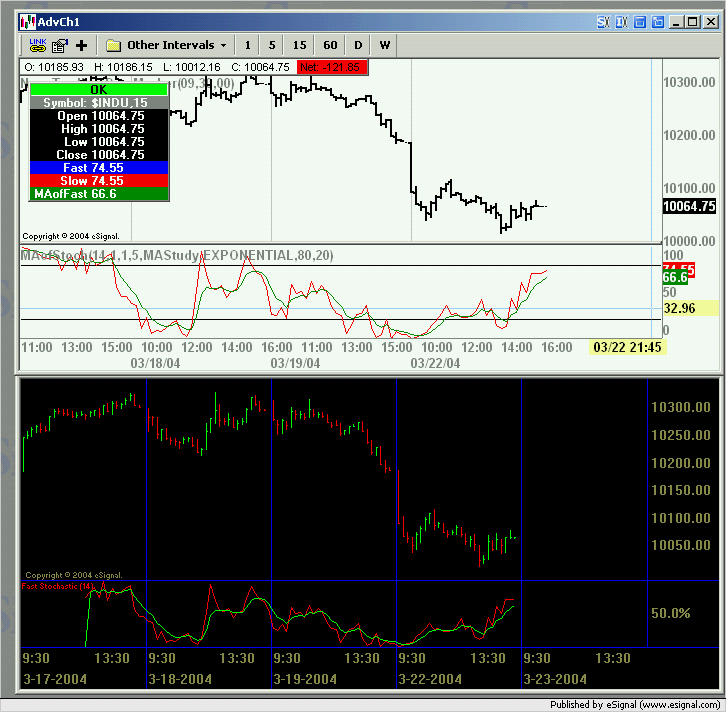
    I am trying to match the advanced charts stochastics with stochastics on the standard charts (step = 9). Is there a way to figure this out or is my hunch right that the two stochastics are calculated to differently to get an exact match? I am using a ten minute chart for reference.

  • #2
    Adam_D
    The attached efs can be setup so as to replicate the Fast Stochastic in Standard Charts.
    In Edit Studies modify the settings to 14,1,1,5,Exponential
    Alex

    Attached Files

    Comment


    • #3
      Thank you Alexis! I am not to sure what this "efs" is but I downloaded it and I'll do some research and figure out how to implement it.

      Can you duplicate slow stochastics with the same stepping of 9 too?

      Comment


      • #4
        Adam_D
        An EFS is a formula script to be used in Advanced Charts.
        Download the efs file to any one of the subfolders of Formulas in the eSignal directory. Then select the chart in which you want to run this formula, right click the chart, select Formulas, navigate to the folder you saved the downloaded file to and click it. This will load the study in the chart.
        Then to modify the settings as suggested in the prior message right click the study window and select Edit Studies. This will open a dialog box where you can modify the default settings
        As to the Slow Stochastic this same formula may be able to do that too with the appropriate settings.
        Alex

        Comment


        • #5
          Thanks Alex, I got the efs loaded and working. I'd still be interested in the slow stochastics settings if it's not much trouble.

          Comment


          • #6
            Alex,

            I've been trying to get the EFS formula you gave me to match the standard charts slow stochastics, (step = 9) but the closest I can get is by using the parameters of 9,4,1,5,exponential. And that isn't very close at all.

            Any thoughts would be appreciated,
            Adam.

            Comment

            Working...
            X