 Tweet
Tweet
i'm not a computer bod, so bear with me on this one.
EFS allows the construction of TA formulas and studies which are then shown in chart form. Values thus generated, eg moving averages, can also be dde'd (I do know where that word came from) into Excel.
Presumably, values generated must be of such a format that forces two dimensions, ie the x and y axis of a chart.
If, for example, I was constructing a twenty-day moving average of the close, I would need twenty data points to produce a single value (the first twenty-day ma).
Let's change this slightly. For the following I need to establish how values would be represented - numerically, or as chart points and lines.
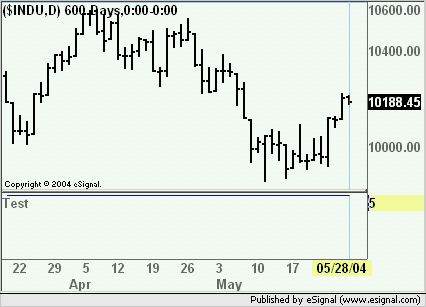
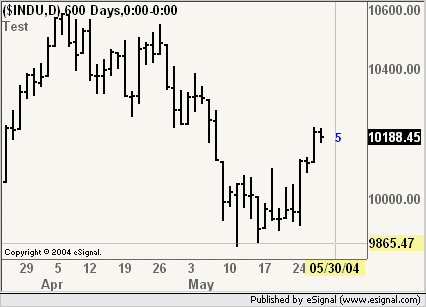
What would happen if I entered an equation, eg, 10 + 20 / 6 = 5?
Would the value (5) be shown?
Extending this, what if I entered, eg, the Black-Scholes formula - would a value be shown? If I entered a series of formulas - would all the values be shown? How would these be displayed.
If we regard a blank chart as a blank sheet of paper awaiting input, then surely columns or lines of figures could be generated and shown.
Thank you for any advice.
Grant
EFS allows the construction of TA formulas and studies which are then shown in chart form. Values thus generated, eg moving averages, can also be dde'd (I do know where that word came from) into Excel.
Presumably, values generated must be of such a format that forces two dimensions, ie the x and y axis of a chart.
If, for example, I was constructing a twenty-day moving average of the close, I would need twenty data points to produce a single value (the first twenty-day ma).
Let's change this slightly. For the following I need to establish how values would be represented - numerically, or as chart points and lines.
What would happen if I entered an equation, eg, 10 + 20 / 6 = 5?
Would the value (5) be shown?
Extending this, what if I entered, eg, the Black-Scholes formula - would a value be shown? If I entered a series of formulas - would all the values be shown? How would these be displayed.
If we regard a blank chart as a blank sheet of paper awaiting input, then surely columns or lines of figures could be generated and shown.
Thank you for any advice.
Grant
Comment