Announcement

Collapse
No announcement yet.

Time & Sales

Collapse
X
 
  • Filter
  • Time
  • Show
Clear All
new posts

  • Time & Sales

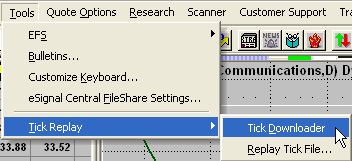
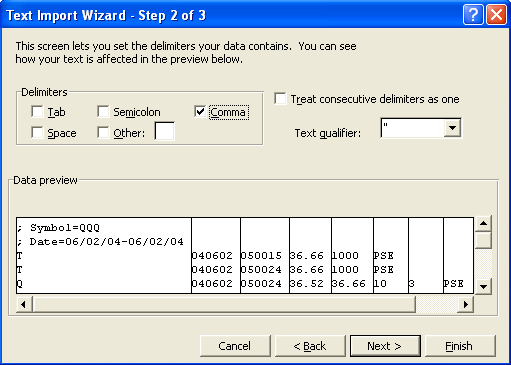
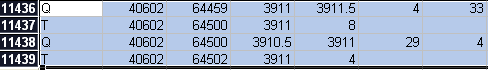
    Can data from a Time & Sales page be imported, linked or copied into Excel?

    And from a previous question, what does the figure in the implied volatility column represent? IV is generally shown as a percentage figure, eg 25%, but here we have, eg 680. Please explain.

    If anyone trades (options) volatility, I'd be interested in swapping ideas.

    Thank you.

    Grant.

  • #2
    Hi Grant,

    This is fairly easy to set up. The first step is to use the Tick Downloader feature in eSignal.


    Next, choose the symbol, the days you want to export and whether you want just trade information or bid/ask info as well.


    Save the file in the eSignal directory. It will save as an .EPF file. Open this file with Microsoft Excel and make sure that you choose the COMMA Delimited option.


    This will propagate the Excel sheet with the Time and Sales data you exported from eSignal. Hope this helps.

    Comment


    • #3
      Time & Sales

      Dear Duane,

      Thank you. Success.

      Left columns contain 40602, 80012 (and 80014 following). What do this refer to (changing format to time, date does nothing.)?

      Can time be determined?

      Can other intervals be specified, eg 1 minute?

      Thank you for you help.

      Grant.

      Comment


      • #4
        Time & Sales

        Dear Duane,

        Thank you. Success.

        Left columns contain 40602, 80012 (and 80014 following). What do this refer to (changing format to time, date does nothing.)?

        Can time be determined?

        Can other intervals be specified, eg 1 minute?

        Thank you for you help.

        Grant.

        Comment


        • #5
          Hi Grant,

          I didn't see specifically where you were noting the 80012 figures. If you could post a screenshot, it would help in defining that data. In the sense of defining a time interval, the closest thing is defining the amount of days you wish to download. This is done through the Tick Downloader.

          If you want to qualify the amount/type of data you want to see, you can export the data out of an Advanced Chart rather than through Time and Sales. By switching to an off-interval, 100T, 100V and so on, one can right click on an Advanced Chart, choose the Tools menu, and choose Data Export, you can then save the file in an HTML or CSV format. Again, this bypasses the Time and Sales option we were speaking about earlier, but it is another way to get the data out of eSignal and into Excel. Hope this helps.

          Comment


          • #6
            Time & Sales

            Dear Duane,

            Will try as you suggested.

            In the meantime, here is a section of the file (with figures at column B & C) I mentioned previously.

            column
            A B C D E
            ; Symbol=AX M4-DT
            ; Date=06/02/04-06/02/04
            T 40602 80012 3893 18
            T 40602 80014 3893 14
            T 40602 80014 3892.5 0
            T 40602 80016 3893 1
            T 40602 80020 3892.5 23
            T 40602 80026 3892.5 20

            Thanks, again.

            Comment


            • #7
              Hi Grant,

              Thanks for the clarification. The numbers in question are referring to the timestamp of the trade. Here's an example.


              The number 64459 is 6:44:59
              64500 is 6:45:00
              64500 is 6:45:00
              64502 is 6:45:02

              and so on...Hope this helps.

              Comment


              • #8
                Time & Sales

                Dear Duane,

                As you suggested re 1 minute intervals from advanced chart - works perfectly.

                Thank you, once again.

                Grant

                Comment

                Working...
                X