 Tweet
Tweet
I'm looking for a chart that plots price vs. volume. I've seen it before but i can't remember what it's called or if esignal supports it. I think the volume is plotted on the x-axis and prices are arranged on the y-axis.
-
-
goryl
In the main menu select File->New->Standard Chart->Price / Volume
Alex -
Hi Goryl,
Is this the type of chart you are referring to?
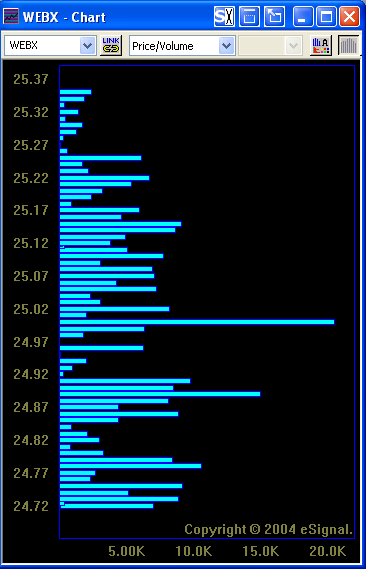
If so, it is available under the Standard Chart option. It is called a Price/Volume chart. Please let me know if this is what you are looking for. Thanks.Comment
-
yes, thank you. What time frames are available?Comment
-
Goryl,
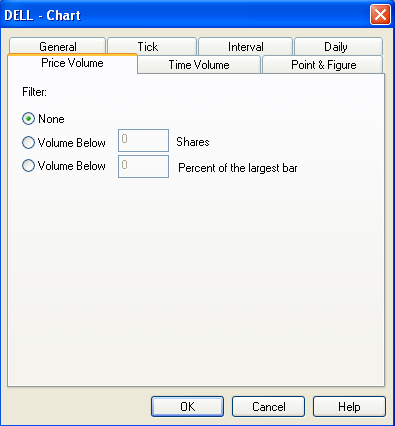
The Price/Volume chart does not take time into account. It is based strictly on the last price and the volume. Below are the settings for the Price/Volume chart. The time interval isn't available, as it doesn’t come into play with how the data is built.
Comment
-
what if i want i want to see just today's trades, or just this weeks trades? any way i can filter these?Comment
-
There isn't a way to filter the Price/Volume chart with any kind of time specs. It can be altered with volume parameters, but again, it takes time out of the equation. Based on what I think you may be looking for, I might suggest taking a look at the Market Profile feature that is available through the Advanced Chart menu. It's a little more complex in its interpretation, but it works in the same way; the major difference being it has an interval setting that may work for you. You can also click on the following link for a video tutorial on the Market Profile feature. It is located under the "What's New in eSignal 7.4?" area. Hope this helps.Comment
Comment