thanks , i did so but wondering why volume is not equal on each bar.
i.e. 1 bar vol. is 250, 1 bar vol is 750
100 tick chart using tradestation 6 shows the same volume of 100 on each bar.
any idea how to get exactly 100 ticks on 1 bar ?
eses
I think that in TS the volume study is based on the number of ticks that compose each bar which is why it would show a constant value.
I believe eSignal actually provides you the volume of contracts traded in those 100 ticks (you may want to confirm this with eSignal though).
If you want bars based on an equal amount of contracts traded then type the number of contracts followed by a V.
In the attached image you can see a 100 tick chart and above it a constant volume chart set at 500 contracts.
Alex
Time Templates do not regulate the Start/End times of the charts as of yet.
This may change at some point and time. However they do determine how many days of tick, tickbar, constant volume bars or seconds bars you want to show (see my reply to Lancer on this subject in this thread http://forum.esignalcentral.com/show...=&threadid=670)
Having said that with the minis you can use the =2 extension to the symbol (for example ES H3=2) which will give you tick charts from 9:30-16:15 EST.
still don´t know how to get this TS6 TICK charts in esignal.
using esignal volume ( 100V)charts is`nt equal to TS tick charts.
i compared in realtime ,very different .
when ts6 creates 1 bar( 100tick bar,not volume bar ) ,esignal creates almost 2 bars ( 100 volume bars )during the same time
TS tick charts show exactly 100 ticks for one bar , this are not volume bars because volume bars can be set extra,see attach. below.
and esignal TICK charts (100T) do not show 100 ticks for one bar,as we mentioned already they show more or less.
to trade my strategy i need exactly what TS6 shows.
any idea how to get this setting ?
using esignal volume ( 100V)charts is`nt equal to TS tick charts
That is correct. 100V in eSignal is the same as if you were using Volume in your TS Format Symbol Settings instead of Tick.
If you want to see the same in eSignal as what you are showing in your image you have to use 100T as the interval
TS tick charts show exactly 100 ticks for one bar , this are not volume bars because volume bars can be set extra,see attach. below.
and esignal TICK charts (100T) do not show 100 ticks for one bar,as we mentioned already they show more or less.
If you use 100T in eSignal and 100 Tick in TS you will see the same things (with perhaps some marginal differences due to different data feeds)
You do need to appreciate though that the volume histogram that TS is plotting is just the simple count of the ticks NOT the actual traded contracts.
In its volume histogram eSignal instead plots (and correctly so IMHO) what the real volume of contracts exchanged was in each 100T bar. In fact not every tick (ie trade) corresponds to 1 contract. Some are 5 contracts, some are 50, others are 1.
As an experiment just leave the cursor in eSignal on the last bar. Now look in the Cursor Window and you will see that it says (for example) TIB 20/100. TIB means Tick In Bar. As new ticks come in that number increases up to 100 then as soon as 100 is reached it creates a new bar and starts counting again.
eses
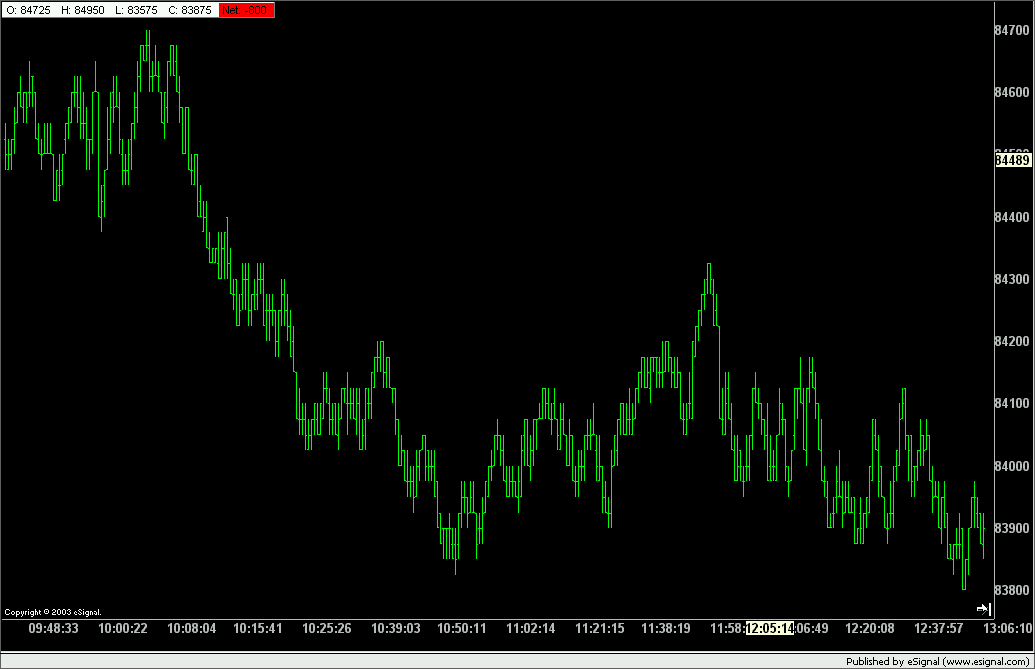
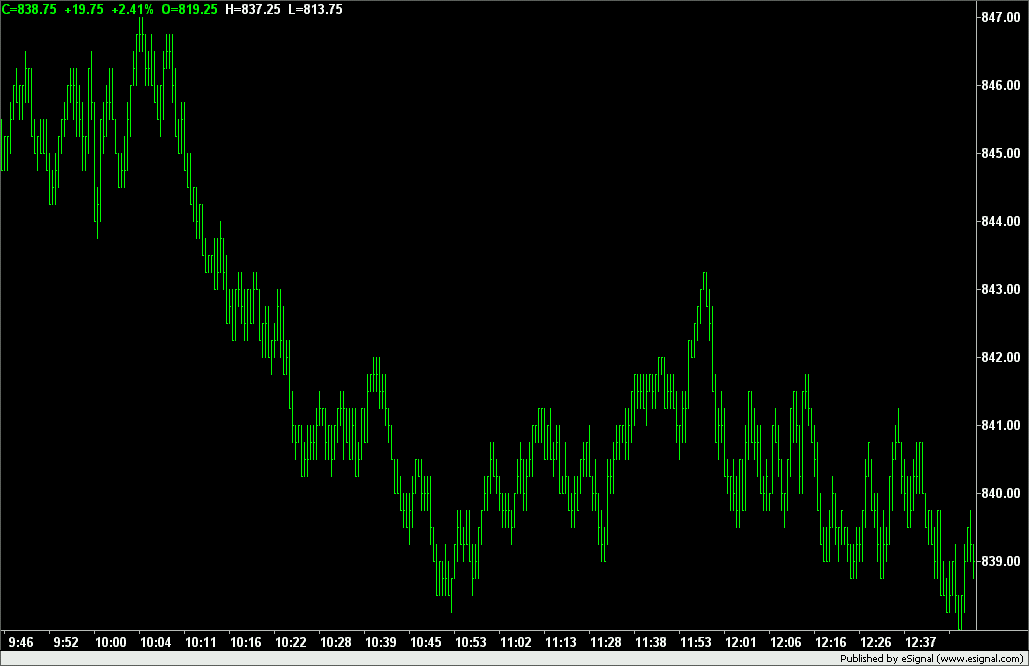
Here are two images for 100T charts.
The first one is using eSignal application
The second one using TS2k
As you can see aside from one or two different ticks (more than likely due to timing in the download) the two plots are almost exactly the same.
So, you should be able to run your strategy without any problems using 100T in eSignal
Alex
i also get 1 day tick datas only,how to backtest this staregy?
are there any plans to provide more datas in future?
eSignal provides up to 10 days of tick data for use with its application (60
for use with third party apps)
If you want more than one day you need to set that up in the Time Template.
You may want to reference the thread I indicated in an earlier message of
mine.
If you are asking whether Tick bars are counted in the same way in the two programs then the answer is yes and as an example attached are two charts of MMM one plotted with eSignal and one in TS2k. I chose 50T as the interval so as to provide more detail and further highlight differences if any.
As you can see one would be hard pressed to find differences between these two charts. However, the charts only show that the methodolgy used for the count is identical as the data comes from the same source.
If instead you are asking why are there differences between plots using different data sources then I don't know. I do know however that they exist and that they become more apparent as the time factor is taken out of the equation.
 Tweet
Tweet
Comment