 Tweet
Tweet
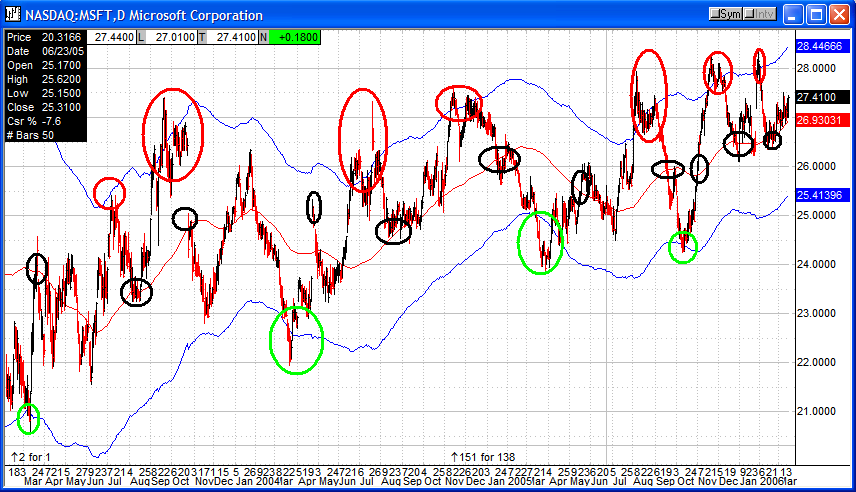
Please examine this chart of daily MSFT with a 100-period, 4-multiplier Keltner channel.
Since 10/2000 one could have traded profitably 11 times as follows:
- Sell breakouts above the upper channel, covering at the center
- Buy breakouts below the lower channel, covering at the center
Positions typically last 3-4 months, with 4% drawdown or less.
The last two moves appear to have yielded 3.8% and 5.1%. Use QCharts' price-measurement tool to measure that. First, make sure the Cursor Data Window is visible. Then, click and hold the left mouse button over one price, drag the mouse to another price, and release the left mouse button. The percent price difference will be shown in the Cursor Data Window next to the label "Csr %".
One can switch to smaller-timeframe tools after a breakout occurs to fine-tune the entry.
Please do your own due diligence. My suggestion is you/we try to find more stocks behaving this way.
Comment