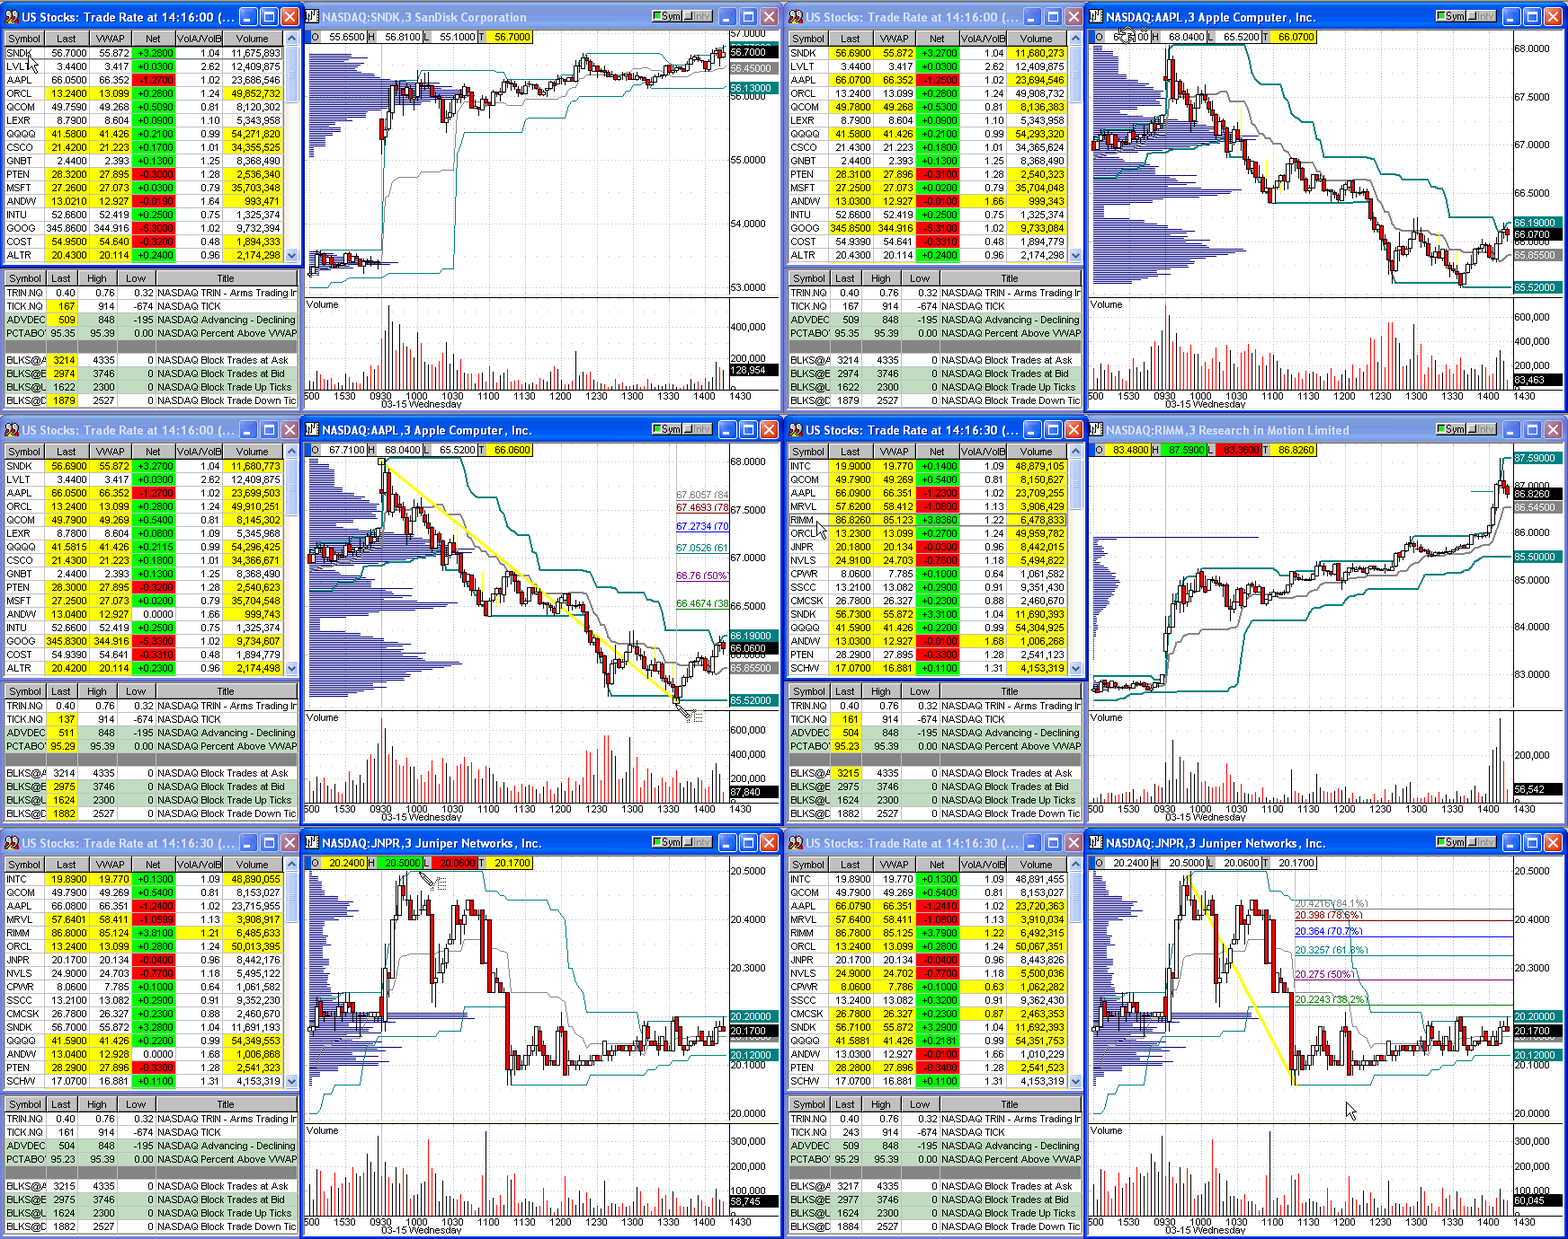
It is truly a great time when a software as intuitive and powerful as QCharts is paired with the business experience of eSignal/IDC. eSignal has been at the helm of a very successful business of supplying real-time, global market data for over 20 years, and it has a very solid history of reliable service and up-time. I am so thrilled at the potential that this pairing will bring.
Here's a quick look at two features that I have found very unique.
Trade Rate Hot List - Allows the trader to quickly ascertain what is moving right now. Put that along with a few Quote Sheet Indicators and you can tell where a stock is versus it's VWAP (Volume Weighted Average Price) and how the Vol@Ask/Vol@Bid is fairing.
Breadthlizer Statistic Symbols - The sheer uniqueness of these symbols is often difficult to fully appreciate. Being able to look at the breadth of a particular market (NASDAQ in this case) with just a handful of symbols is a thing a beauty. For instance where else can you find out...
- What percentage of NASDAQ, NYSE, DJIA stocks are trading above their VWAP?
- How many block trades were at the Ask? at the Bid?
- How many block trades were on the up-tick? on the down-tick?

Comment