Announcement

Collapse
No announcement yet.

ES-DAILY and INTRADAY

Collapse
X
 
  • Filter
  • Time
  • Show
Clear All
new posts

  • ES-DAILY and INTRADAY

    The Continuous Charts show the wrong date/time for the low of the ES. I cannot comment on the price because perhaps that is the way continuous charts are constructed but getting the time and date wrong is misleading and needs to be corrected.

    The ES07M shows correct date/time.

    BTW would this also mean that other dates/times are wrong? Would be difficult to check for other quarters.

    Thank you,

    Kate
    Attached Files

  • #2
    Kate
    Are you referring to the low on the daily bar of March 6 of the continuous contract?
    If that is the case then that is correct both in price and in time as far as I can see since that price was traded on the March 2007 contract on March 5 at 18:06 EST which would place it in the trade session for March 6
    Alex

    Comment


    • #3
      Hey Ms. Kate,

      In addition to what Alex just said...
      Well, that's just the way continuous contracts work. Always been this way, that there is potential goofyness at roll and for awhile thereafter. The attached screenshot shows the concatenation of "H" and "M" data at roll on 3/8. fwiw, I rarely use continuous contracts, and never right after roll due to the price differential and inherent chart diffs.

      LAM
      Attached Files

      Comment


      • #4
        Hi Alex,

        On the Daily Chart (for eg the low in March looks to have been made on March 6th...whereas the fact of the matter is that it was made on March 14th. Please look again at the slope of the two daily charts on my pic. Same applies to intraday charts.
        Time tools are based on TIME which means starting or ending on the correct bar... If one uses time cycles starting at lows in previous quarters and as in this quarter they are not accurate the time tool will not yield accurate results either.

        This is why we are cautioned NOT to use price in the continuous chart but to refer it for timing only.

        AGAIN The March quarter charts are showing correct dates but the continous is not for the same period.

        I am not questioning the low price of ES07H on march 6th but the ES07H made a lower Low on March 14th as did the ES07M. Since ES07M data is showing on March 14th and this carries a 13-14 premium it appears as if it the low for the ES was made on March 6th instead of March 14th. Hope this clarifies whatever my pic did not.

        Kate

        Comment


        • #5
          Hi Larry,

          I know you don't use continuous charts nor do you use Fibs for timing etc.).

          But I do so while it is not expected for price to be correctly reflected due to premium etc.. it is necessary for the time of the low to be correct, be it for the march or june contract. If it is not correct what is the point of a continuous chart?

          Kate

          Comment


          • #6
            Kate
            I am aware that both contracts [ie ES07H and ES07M] made a new low on March 14 however as Larry illustrated in his reply the continuous contract is tracking the June contract from March 8 and this is trading approximately 12 points higher than the March contract. This difference between the prices of the two contracts is why the low of March 14 on the continuous contract is not lower than the one of March 6.
            Alex

            Comment


            • #7
              Alex,

              As per Larry's charts and Mine all of which illustrate the same thing the low in March is not being shown on the correct date. I know the reasons as I explained to you in my last post but those reasons are related to premium and price.,,

              The date showing the low in March so far must be adjusted to reflect the Low in March on a continuous contract..otherwise it defeats the purpose.

              If you use fibs for time forecasts and were looking at a continuous chart a month from now would you start your bar count on Mar 6th or Mar 14th? If you used the Mar 6th date as shown on the charts currently how accurate would you expect your work to be?

              Kate

              Comment


              • #8
                Originally posted by ketayun
                The date showing the low in March so far must be adjusted to reflect the Low in March on a continuous contract..otherwise it defeats the purpose.
                The previous contract's data isn't adjusted. You can't do what you wish with QCharts 5.1 continuous contracts. Especially with a recent roll and a 12 point differential. That's why I don't use them.

                LAM

                Comment


                • #9
                  Larry,

                  Are you saying that at some future date (?) continuous chart will show March 14 being lower than March 6th or are you saying that it will always show March 14th Higher than March 6th? If the latter, may I ask the value of a continuous charts?

                  I do understand you don't use them but what is the purpose of having them if not for accurately forecasting time..... which again is based on correct time high/low?

                  Kate

                  Comment


                  • #10
                    Originally posted by ketayun
                    Larry,

                    Are you saying that at some future date (?) continuous chart will show March 14 being lower than March 6th or are you saying that it will always show March 14th Higher than March 6th? If the latter, may I ask the value of a continuous charts?

                    I do understand you don't use them but what is the purpose of having them if not for accurately forecasting time..... which again is based on correct time high/low?

                    Kate
                    Kate,

                    The ES.Q is a mechanical, price unadjusted concatenation of contracts at roll date. At least at this time, that's just how it works. The prices on any given date will reflect the price of whatever contract was front month at that time. ES.Q will always show March 14th Higher than March 6th. I'm unaware of any plans to introduce a back-adjusting price function into 5.1.

                    It's up to the individual to decide if the way it works at this time is usable or of value. As to the possibility of accurately forcasting any symbol, well...<grin>...I'll leave that to the TA Gods, tea leaf readers, and bone casters.

                    LAM

                    Comment


                    • #11
                      O.k. Larry, if that is the way it is.. I will just use my Line tool and mark it in so that I can use the continuous charts.

                      BTW I do recall the es.q showing esH well after the 8th, but that is neither here nor there.

                      Thanks very much for your help as always,

                      Kate

                      Comment


                      • #12
                        Originally posted by ketayun
                        BTW I do recall the es.q showing esH well after the 8th, but that is neither here nor there.
                        Yep. The file that has the concatenation statements, CompSyms2.INF, the one with the "M" front month update, was uploaded to the servers on the 13th.

                        LAM

                        Comment


                        • #13
                          Kate
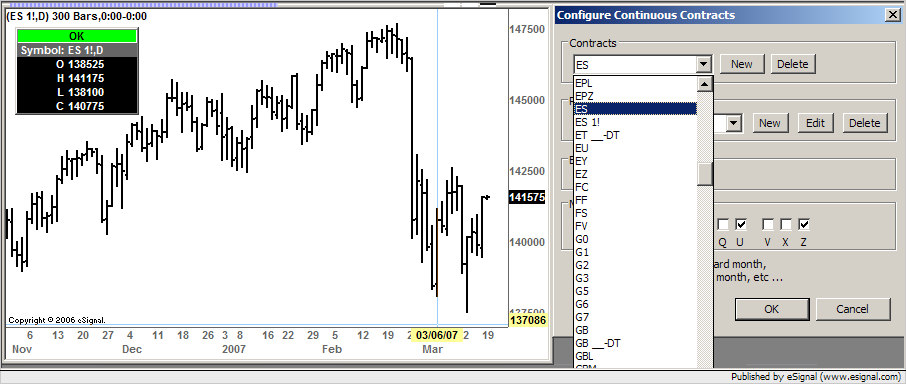
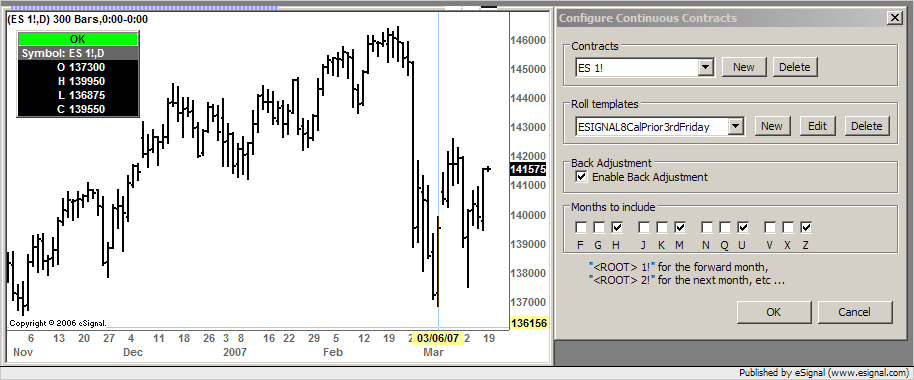
                          To do what you are asking would require the ability to back adjust the continuous contracts which as Larry has already said QCharts does not have. FWIW this functionality is available in eSignal through a specific tool that allows to build user defined continuous contracts. (see the enclosed screenshot for an example of the back-adjusted ES).
                          I don't know what plans eSignal may have for QCharts in this regard however if you would like to submit this as a suggestion for future enhancements send an email to [email protected]
                          Alex


                          Originally posted by ketayun
                          Alex,

                          As per Larry's charts and Mine all of which illustrate the same thing the low in March is not being shown on the correct date. I know the reasons as I explained to you in my last post but those reasons are related to premium and price.,,

                          The date showing the low in March so far must be adjusted to reflect the Low in March on a continuous contract..otherwise it defeats the purpose.

                          If you use fibs for time forecasts and were looking at a continuous chart a month from now would you start your bar count on Mar 6th or Mar 14th? If you used the Mar 6th date as shown on the charts currently how accurate would you expect your work to be?

                          Kate

                          Comment


                          • #14
                            Originally posted by Alexis C. Montenegro
                            FWIW this functionality is available in eSignal through a specific tool that allows to build user defined continuous contracts. (see the enclosed screenshot for an example of the back-adjusted ES).
                            Alex,

                            I've been aware of the back adjustment function as being available in eSignal, but have never tried it before, what with being a casual and sporadic and essentially superficial user of eSignal.

                            Can you get ES #F to back adjust prices? I can get ES 1! to back adjust, but not ES #F. The screenshot should illustrate what I'm trying to do. Is there something operationally or contextually I'm not getting about ES #F that's not allowing what I've tried here to work?

                            Thanks.....LAM
                            Attached Files

                            Comment


                            • #15
                              Larry

                              Can you get ES #F to back adjust prices?
                              Not that I am aware of.

                              I can get ES 1! to back adjust, but not ES #F
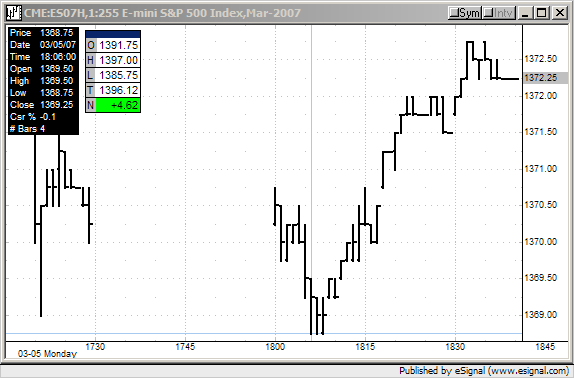
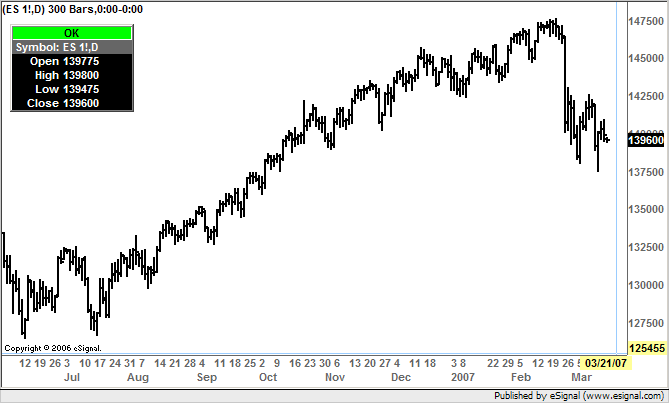
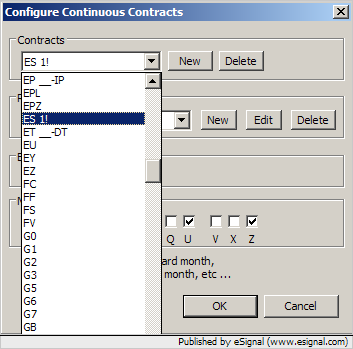
                              I think the reason you are seeing back adjusted prices when you type ES 1! as the chart symbol is because in the Continuous Contract Settings list you have an entry for the root symbol ES (visible in your image above ES #F) which is what the application is using to build the continuous contract. Try deleting the root symbol ES and leave only the root symbol ES 1! and you should see that the continuous contract will no longer be back adjusted when you create a new chart or refresh the existing one
                              In the first two screenshots below you can see that I have only ES 1! listed as the root symbol and the result is that the contract is not back adjusted. In the third screenshot instead you can see that once I add the root symbol ES the continuous contract is back adjusted
                              Alex


                              Comment

                              Working...
                              X