Hello
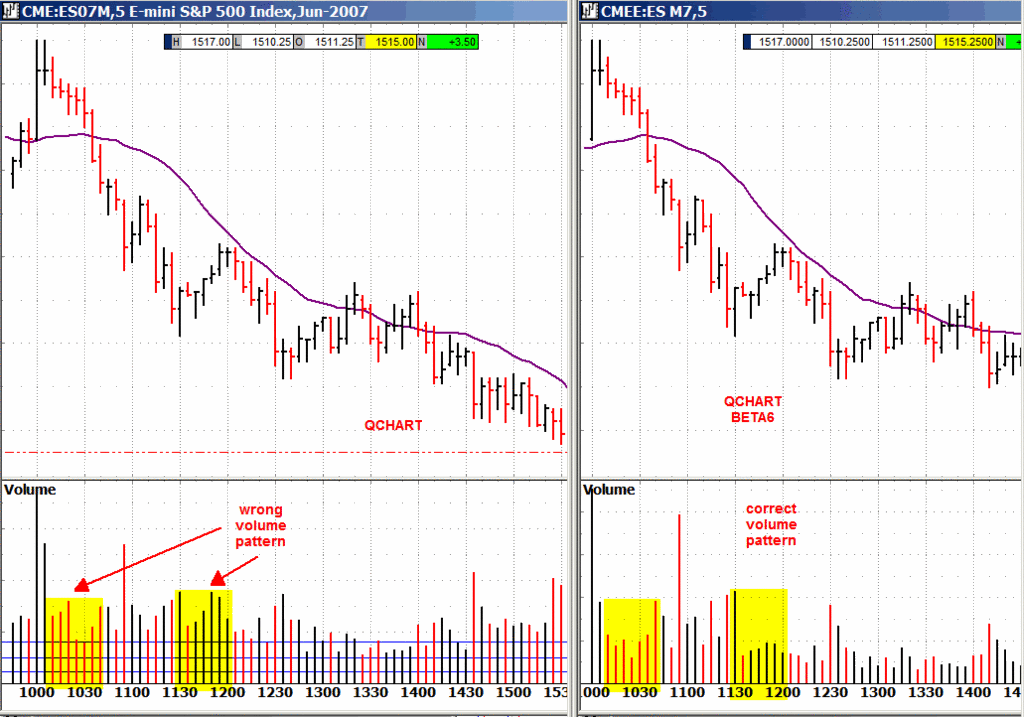
All through out this week, I have been seeing erroneous data across the servers.
For example, TXRH on 05/01/07 made a high of 15.89 between 09:30-09:45. On cc-08.sc8, the high on the 15 minute chart for this date is 15.77. However the daily chart shows the correct high of the day which is 15.89. When the server is switched to cc-10.sc8, both daily and the 15 minute charts show the correct values.
As another example, today (05/03/07), one of the servers showed a traded price of 28.46 for WLK at 9:34. However as one looks at WLK's 15 minute chart for today, 30.37 (or 30.34 depending on which server is used!!!) is the low of the day.
These are just two examples of absolutely horrendous price, volume and indicator data that I have experienced through out this week.
Jay, please make an effort to correct these errors. As is, the product is absolutely useless!!!!!!!!!!!!!!
Thanks in advance.

Comment