 Tweet
Tweet
Hello
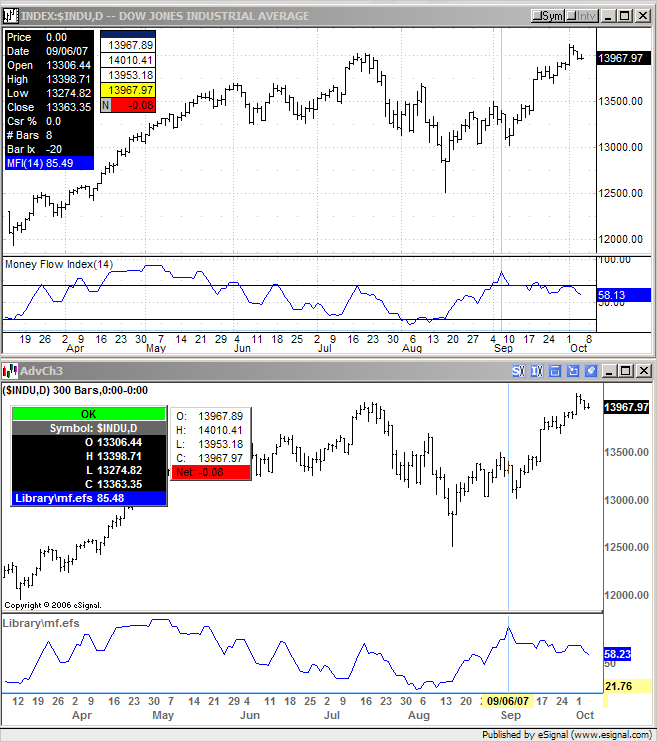
It seems that the MFI study in Q6.0 is significantly different than the MFI study in Q5.1. A few years ago I asked technical support how this indicator was calculated. The answer was the following;
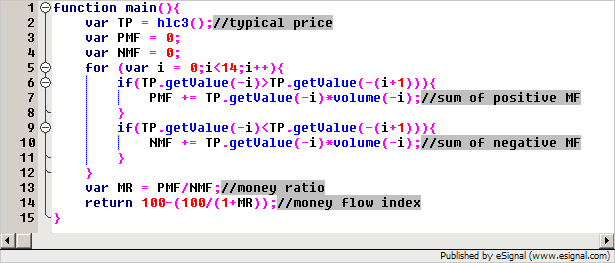
Typical Price = (high + low + close)/3
MFI = RSI(TYpical PRice, n) where n = period.
Is the new MFI calculated differently than the above formula? If so, please elaborate.
Thanks in advance.
It seems that the MFI study in Q6.0 is significantly different than the MFI study in Q5.1. A few years ago I asked technical support how this indicator was calculated. The answer was the following;
Typical Price = (high + low + close)/3
MFI = RSI(TYpical PRice, n) where n = period.
Is the new MFI calculated differently than the above formula? If so, please elaborate.
Thanks in advance.

Comment