Since the rollout of 6.0 to the public this fall, I have been reading with interest the comments and concerns(1) with respect to the significant step backwards in capability of 6.0 vs. 5.1. I’m sure that QCharts’ staff understands how users can become so very emotional about the product – for most of us, QCharts is the primary tool we use to either make a living or to supplement our livelihood. And, when one’s primary tool is broken, it’s easy to understand that a lot of emotion will get wrapped around it very quickly.
I have been tempted to enter the fray of conversation, however, the engineer in me decided instead of continuing to report that it just doesn’t work properly, to gather empirical data in an attempt to focus efforts on what is actually going on. Many thanks to Larry Marchman for assistance in compiling these data.
For most of us, we experience significant %CPU increases, which may, in fact, contribute to any of the following items:
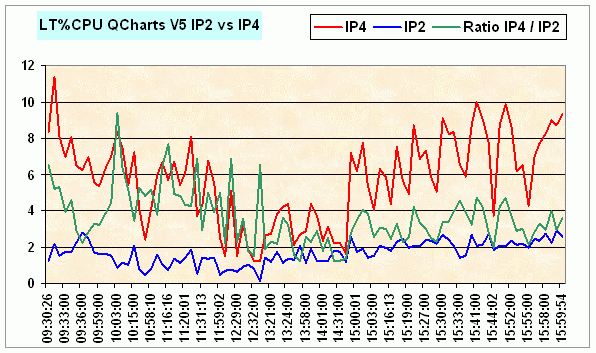
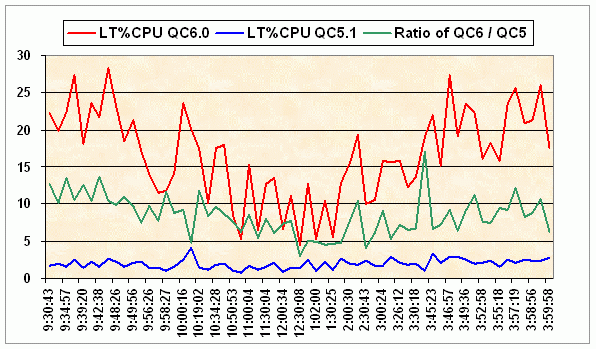
I decided to run some tests to quantify the %CPU increases in 6.0 vs. 5.1 and also compare the %CPU between 5.1 on an IP4 server vs. an IP2 server(2). The tests were run 11/28-11/30/07 and all the data, complete analysis, overall test results, and sample workspace used can be viewed here
A little background[list=1][*]Currently, 5.1 draws primarily from IP2 Continuum Servers. It is known that IP2 is dropping up to 70% of tick volume depending on the time of day. IP4 is feeding tick volumes equivalent to the eSignal servers. So if the same workspace is run concurrently on two instances of QCharts 5.1 (IP4 & IP2), one can approximate the increase in %CPU that should be required to run 6.0 given its higher tick volume.[*]Again running the same workspace, one can determine the amount of %CPU required to run 5.1-IP2 vs. 6.0 on the eSignal servers.[*]The difference in the %CPU between #’s 1 and 2, above, can be attributed to processing inefficiencies. [/list=1]


[
A concise summary of the results follows:[list=1][*]QC5.1 on IP4 vs. IP2 servers utilized an average of 3.58 times more %CPU. Stated another way, IP4’s full-tick volume required 258% more %CPU than the throttled (dropping up to 70%) volume of IP2.[*]QC6 v QC5-IP2 utilized an average of 8.11 times more %CPU. Stated another way, QC6.0 required 711% more %CPU.[*]Given this baseline, one can then approximate the increased amount of CPU required due to processing inefficiencies: 8.11 – 3.58 = 4.53 times more %CPU. Stated another way, over half of the increase in %CPU in 6.0 is due to processing inefficiencies. [/list=1]
The increase in CPU usage is due to two factors: (1) The increased number of ticks in the eSignal feed; and (2) Processing inefficiencies. The extra load due to processing inefficiencies is significant, as great as or greater than the increase due to a greater number of ticks.
Note: These numbers are the TaskInfo long term averages, LT%CPU. In the detailed reports, there is another set of numbers developed from summing the immediate sample values: %CPU. These numbers can be spikey for various reasons, and show even wider ratios.
Conclusions - So, what does this mean to the average QC user?
A user that has a 5.1 workspace that typically uses little %CPU on his/her specific box may very well be good to go with 6.0 as is, even with the increased %CPU hit s/he will experience.
If the user’s workspace typically uses 12.3 % CPU(3) or more for QC5.1-IP2, that same workspace would typically require 100% CPU just for the QCharts program in QC6.0 (not accounting for other programs running on said computer).
It's up to the individual user to determine the impact of a given workspace on their specific box and choose a course of action. Whether or not they are good to go as is or whether cutting the data demands of the workspace to compensate for the increased %CPU will suffice. Or, whether to buy a more powerful box at this time to run their existing workspace if unwilling to (a) cut their existing workspace and/or (b) wait on processing efficiency improvements.
Again...The increase in CPU usage is due to two factors: (1) The increased number of ticks in the eSignal feed; and (2) Processing inefficiencies. Here's hoping the processing inefficiencies is the number one priority with the development folks.
Carol
Footnotes:
(1) From all but one user with seemingly magical computers in an alternate universe.
(2) The IP2 feed from Comstock is a relatively small capacity pipe, and typically sends throttled (planned dropped ticks) data. The throttling can be up to 70% during market open and going into the close; lesser so midday. The IP4 feed from Comstock is a higher capacity pipe, and contains the same set of ticks as the eSignal feed, for all practical purposes. SantaClara 10 and 11 are on the IP4 feed, but can’t really be used for daytrading purposes due to frequent queuing.
(3) The 12.3 number (100% divided by the 8.11 ratio) is the cumulative average of captures throughout the day. In actual experience, there is a wide range of %CPU differences between 6.0 and 5.1. This is a function of data trade rates and the amount of IP2 throttling at any moment in time. As one example here to reinforce that the 12.3% number is but an average, a user that normally experiences QCharts using 9% during higher volume periods with 5.1-IP2, and has 10% for all other programs running, can peg during these periods due to a QC6 vs QC5 ratio factor of 10X being probable. See the data and charts in the detailed reports for actual ranges experienced during the data collection process. See full report here
I have been tempted to enter the fray of conversation, however, the engineer in me decided instead of continuing to report that it just doesn’t work properly, to gather empirical data in an attempt to focus efforts on what is actually going on. Many thanks to Larry Marchman for assistance in compiling these data.
For most of us, we experience significant %CPU increases, which may, in fact, contribute to any of the following items:
- Lock-ups
- Significant (20 seconds to many minutes' ) delay in populating charts
- Unresponsiveness
- Symbols jumping from one Quote Sheet to another &/or replacing other symbols within a single Quote Sheet
- Chart Time Interval &/or Symbol arbitrarily changing without user input
- And other various bugs and functions not as yet implemented.
I decided to run some tests to quantify the %CPU increases in 6.0 vs. 5.1 and also compare the %CPU between 5.1 on an IP4 server vs. an IP2 server(2). The tests were run 11/28-11/30/07 and all the data, complete analysis, overall test results, and sample workspace used can be viewed here
A little background[list=1][*]Currently, 5.1 draws primarily from IP2 Continuum Servers. It is known that IP2 is dropping up to 70% of tick volume depending on the time of day. IP4 is feeding tick volumes equivalent to the eSignal servers. So if the same workspace is run concurrently on two instances of QCharts 5.1 (IP4 & IP2), one can approximate the increase in %CPU that should be required to run 6.0 given its higher tick volume.[*]Again running the same workspace, one can determine the amount of %CPU required to run 5.1-IP2 vs. 6.0 on the eSignal servers.[*]The difference in the %CPU between #’s 1 and 2, above, can be attributed to processing inefficiencies. [/list=1]


[
A concise summary of the results follows:[list=1][*]QC5.1 on IP4 vs. IP2 servers utilized an average of 3.58 times more %CPU. Stated another way, IP4’s full-tick volume required 258% more %CPU than the throttled (dropping up to 70%) volume of IP2.[*]QC6 v QC5-IP2 utilized an average of 8.11 times more %CPU. Stated another way, QC6.0 required 711% more %CPU.[*]Given this baseline, one can then approximate the increased amount of CPU required due to processing inefficiencies: 8.11 – 3.58 = 4.53 times more %CPU. Stated another way, over half of the increase in %CPU in 6.0 is due to processing inefficiencies. [/list=1]
The increase in CPU usage is due to two factors: (1) The increased number of ticks in the eSignal feed; and (2) Processing inefficiencies. The extra load due to processing inefficiencies is significant, as great as or greater than the increase due to a greater number of ticks.
Note: These numbers are the TaskInfo long term averages, LT%CPU. In the detailed reports, there is another set of numbers developed from summing the immediate sample values: %CPU. These numbers can be spikey for various reasons, and show even wider ratios.
Conclusions - So, what does this mean to the average QC user?
A user that has a 5.1 workspace that typically uses little %CPU on his/her specific box may very well be good to go with 6.0 as is, even with the increased %CPU hit s/he will experience.
If the user’s workspace typically uses 12.3 % CPU(3) or more for QC5.1-IP2, that same workspace would typically require 100% CPU just for the QCharts program in QC6.0 (not accounting for other programs running on said computer).
It's up to the individual user to determine the impact of a given workspace on their specific box and choose a course of action. Whether or not they are good to go as is or whether cutting the data demands of the workspace to compensate for the increased %CPU will suffice. Or, whether to buy a more powerful box at this time to run their existing workspace if unwilling to (a) cut their existing workspace and/or (b) wait on processing efficiency improvements.
Again...The increase in CPU usage is due to two factors: (1) The increased number of ticks in the eSignal feed; and (2) Processing inefficiencies. Here's hoping the processing inefficiencies is the number one priority with the development folks.
Carol
Footnotes:
(1) From all but one user with seemingly magical computers in an alternate universe.
(2) The IP2 feed from Comstock is a relatively small capacity pipe, and typically sends throttled (planned dropped ticks) data. The throttling can be up to 70% during market open and going into the close; lesser so midday. The IP4 feed from Comstock is a higher capacity pipe, and contains the same set of ticks as the eSignal feed, for all practical purposes. SantaClara 10 and 11 are on the IP4 feed, but can’t really be used for daytrading purposes due to frequent queuing.
(3) The 12.3 number (100% divided by the 8.11 ratio) is the cumulative average of captures throughout the day. In actual experience, there is a wide range of %CPU differences between 6.0 and 5.1. This is a function of data trade rates and the amount of IP2 throttling at any moment in time. As one example here to reinforce that the 12.3% number is but an average, a user that normally experiences QCharts using 9% during higher volume periods with 5.1-IP2, and has 10% for all other programs running, can peg during these periods due to a QC6 vs QC5 ratio factor of 10X being probable. See the data and charts in the detailed reports for actual ranges experienced during the data collection process. See full report here


Comment