 Tweet
Tweet
how to calculate the RSI, please
-
-
Re: calculate RSI
denisthor
If you are trying to calculate the RSI in Excel see the worksheet I posted in this thread
Alex
Originally posted by denisthor
how to calculate the RSI, please -
Re: Re: calculate RSI
THANK YOU , ALEX!!!!!!!!!!!!!!!!!!Originally posted by Alexis C. Montenegro
denisthor
If you are trying to calculate the RSI in Excel see the worksheet I posted in this thread
Alex
Comment
-
Re: Re: Re: calculate RSI
denisthor
You are most welcome
Alex
Originally posted by denisthor
THANK YOU , ALEX!!!!!!!!!!!!!!!!!!
Comment
-
calculate RSI(close,4) $INDU
I have done an exercise to check the file that you sent me.
I used $INDU with RSI (Close,4) daily. I have taken 11/04/2010 figure. The candle gave me RSI = 94,32, the excel file gave me RSI = 100.
I have tried in INTRADAY cenary and I had the same situation. Why the excel file result is different of the candle's result?
Thanks in Advance!
I'm looking forward to receiving your reply as soon as possible.
Best Regards,
DenisComment
-
Re: calculate RSI(close,4) $INDU
Denis
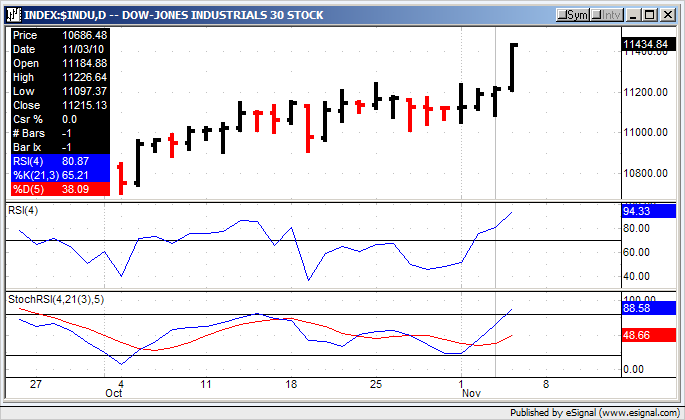
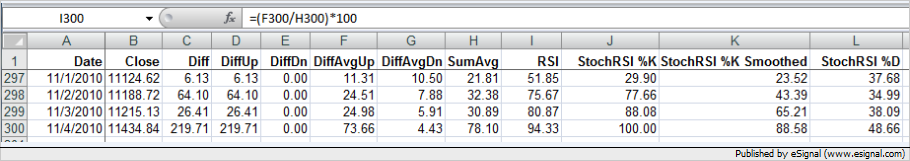
At my end the spreadsheet I posted earlier [adjusted for an RSI length of 4] is returning the same values as the chart as you can see in the enclosed screenshots.
Note that in the chart I placed the vertical cursor on the second to last bar so as to compare also that bar's values [since the most recent bar's values are displayed in the scale] and as you can see even those values match the ones returned by the spreadsheet.
As a further confirmation I also added the Stochastic RSI to the chart and also those values match the ones in the spreadsheet
Alex
Originally posted by denisthor
I have done an exercise to check the file that you sent me.
I used $INDU with RSI (Close,4) daily. I have taken 11/04/2010 figure. The candle gave me RSI = 94,32, the excel file gave me RSI = 100.
I have tried in INTRADAY cenary and I had the same situation. Why the excel file result is different of the candle's result?
Thanks in Advance!
I'm looking forward to receiving your reply as soon as possible.
Best Regards,
DenisComment
Comment