 Tweet
Tweet
Dear experts
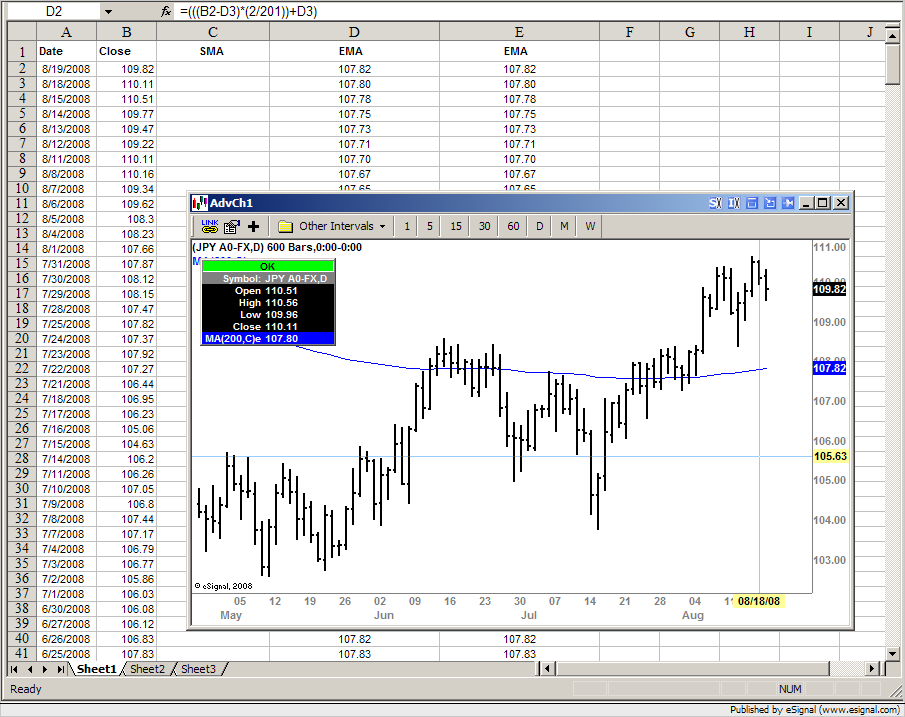
I have searched the forum to see if I can build the EMA in an excel spreadsheet that ties into the Esignal charts EMA but cannot find it. I am using QLink to down load the OHLC values into Excel and want to calculate the 50, 100 and 200 period EMA's
I know that the formula for today's EMA
= yesterday's EMA x (100 - N%) + today's price x N%
To calculate the value of N:
N = 2 / ( P + 1 )
where P = the number of periods for the EMA.
I also tried putting in the SMA to the starting point of the calculation for the EMA.
Does anyone know how to do this please?
All help greatfully received. Thank you in advance.
Kind regards
Fibbo
Comment