Announcement

Collapse
No announcement yet.

howtodo: how to make qlink barcharts instead of tick charts with with requested ticks

Collapse
X
 
  • Filter
  • Time
  • Show
Clear All
new posts

  • howtodo: how to make qlink barcharts instead of tick charts with with requested ticks

    Hi,
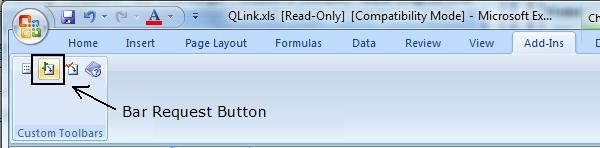
    Could someone please help me with this? I would like to make qlink barcharts instead of tick charts in excel. How can I do it?

    Thank you.

  • #2
    halo972,
    To create a bar chart you'll first need to gather the data you'll be using to create the chart.
    Select the area or first cell where the data will be on the spreadsheet.

    Using this KB Article 4000 (QLink User Guide) section 3.1.2 to created your request for data.

    .

    Once you have the data, select another area on the spreadsheet to creat the charts.

    Highlight Time, Open, High, Low, and Close columns,
    Click Insert-->Chart and from the list select which chart type you'd like to use. And that's it.


    Please let me know if you run into any problems or have more questions

    Comment


    • #3
      Thanks for taking the time to reply, but that's not what I wanted to do.

      I know there is a request bars feature but the options in available fields are limited.

      I would like to use the Bid Ask fields --available in the tick request-- as bars eg 5 minute much like the bidaskvolumeanalysis.efs by jasonk since efs does not allow saving historical data and charts.

      This really should be an excel programming question but I'm posting it in qlink in the hope that others have done something similar. Has anyone done this? It would be interesting to see the big ask volume bars for a basket of stocks as well as individual futures (depends how it is configured in excel).

      Comment

      Working...
      X