Announcement

Collapse
No announcement yet.

Confirming Entries with Time & Sales: Tape Reading Tips

Collapse
X
 
  • Filter
  • Time
  • Show
Clear All
new posts

  • Confirming Entries with Time & Sales: Tape Reading Tips

    In this thread, we'll be discussing various ways to use eSignal's time and sales windows to help confirm breakout and breakdown entries.

    One tip: I like using a large tape that's linked and easily visible, at a minimum it looks like:


    I frequently like to follow the sizes column (far right), as seen in:


    Question: does anybody know if the time/sales display will be configurable in an upcoming eSignal release? I'd like to be able to just show price size sizes columns, for example..


    thanks,

    Ken Calhoun, Pres.
    Daytrading University

  • #2
    Ken

    T&S it is configurable in the ADVANCED CHART ;

    Select FILE , NEW, ADVANCED CHART and third row is T&S

    Cordially
    Fabrizio L. Jorio Fili

    Comment


    • #3
      Thanks Fabrizio... is there a way to make it look like:


      but with configurable columns?

      much obliged if you could email a file, or let me know how to do it..


      thanks!

      [email protected]

      Comment


      • #4
        Ken


        Here is the SNAPSHOT of T&S on ADVANCED CHART

        Can be config. in different manners. I guess even more additional improvements will be in next betas and in Rel. 8

        Hope it helps


        Cordially
        Fabrizio L. Jorio Fili

        Comment


        • #5
          Ken
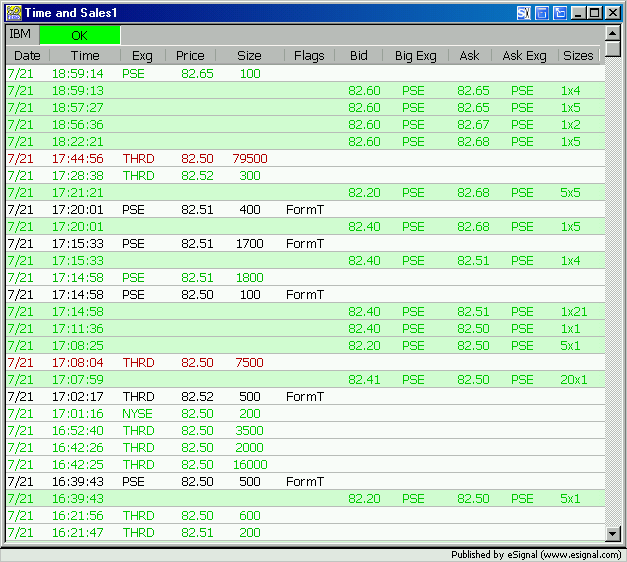
          Complementing what Fabrizio has posted here is a replica of what you were asking created with the new Time and Sales Window.


          To create this T&S window you need to install 7.4 Release Candidate.
          Then select File->New->Advanced Chart->Time and Sales or click the New icon in the eSignal Toolbar and select Time and Sales Window.

          When the window opens you can simply type the symbol as if you were in an Advanced Chart.
          To get to the Properties right click anywhere on the window or select [b]Time and Sales Options[b] on the Main Menu.
          In the Properties dialog box you will see a checkbox for Short Header (Bid/Ask compacted). Unchecking that will show all the available columns (as in the image above).
          Also, by clicking and dragging in selected parts of the headers you can increase/decrease the width of the columns and you can change their position.
          Hope this helps
          Alex

          Comment


          • #6
            To hopefully help further, here's a video describing the basics of the new Time & Sales window.

            Time & Sales - What's New in 7.4
            Regards,
            Jay F.
            Product Manager
            _____________________________________
            Have a suggestion to improve our products?
            Click Support --> Request a Feature in eSignal 11

            Comment


            • #7
              nice to hear re customizable t/s

              *very cool* Thanks much! We've been wanting something like this for years...

              I'll let all my traders know as well, and point them to the forum here..

              this will make a big difference in trading, I'll get some of my traders to develop formulas to attach re adx/volume/sector/trin breakouts with time/sales..

              any ideas on a way to code a formula or other visual indicator that would provide a "tape velocity" type of indicator? that's one thing I do manually daily, it would great to be able to have a speedometer of sorts, that would show visually, how many transactions per minute (volume weighted if desired) are going off..

              that's a suggestion, for a future revision, if it's not already in there..

              eSignal - always the best!

              thx..

              ken

              Comment

              Working...
              X