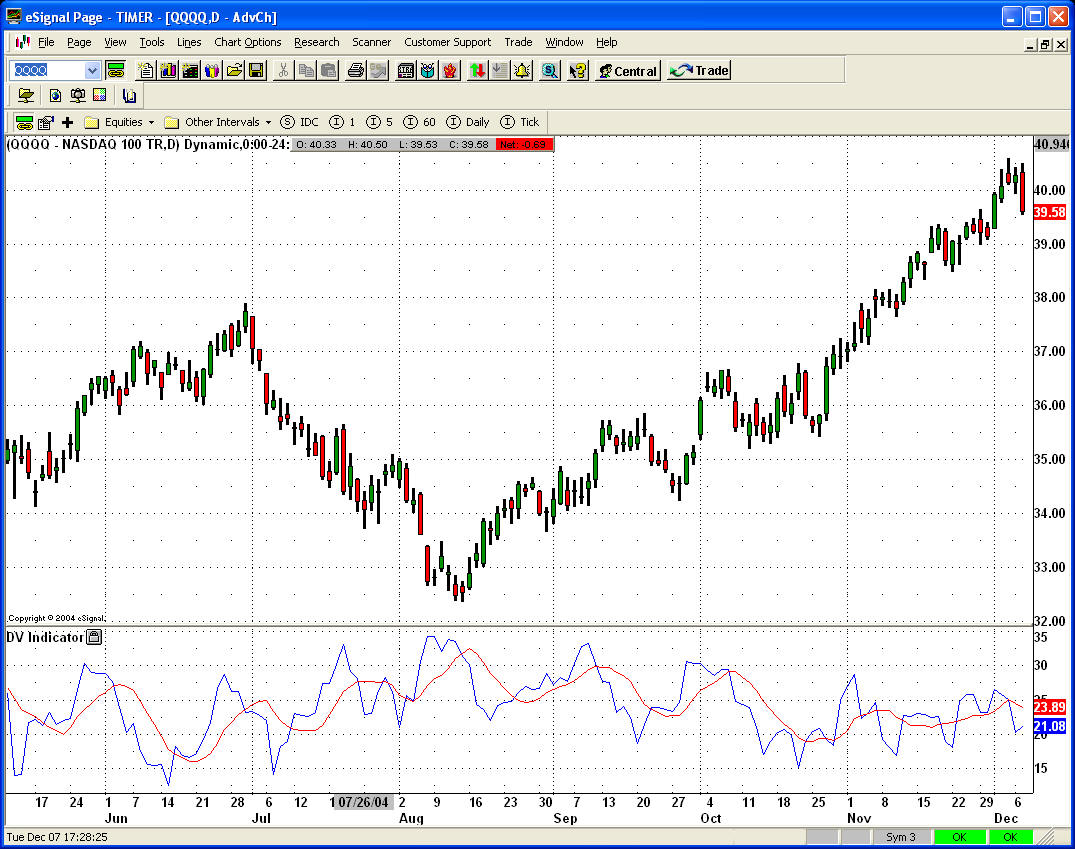
The idea for the Directional Volatility was first presented at a http://www.OUGA.com meeting by my long time friend and former TradeStation Solution Providers Tech Advisor, Miles Dunbar.
I coded it and played around with it a bit, before offering to our Diamonds Users last summer. This is an excellent addition to your daytrading toolbox.
Here it is offered to you Free of Charge till February 1st, 2005. Consider it as your Xmas Gift from HA.
Here is where you download it from: HamzeiDV.efs
A how-to pdf document will be posted shortly.
In a capsule form, this is how we use this indicator:
We all know that prices have cycles but did you know that volatility has cycles too ? What DV does here is to identity when the volatility has collapsed and thus the next big volatile day is coming.
Look for low levels of blue curve... they usually precede a big day in the asset you are following.
DO NOT USE LESS THAN DAILY DATA COMPRESSION, as interday volatility is not a mystery, it is an "U" -- that it is highest at the Open and the Close. That fact we know.
The best days for intraday trading are the big directional trades, that is buy the open and sell the close, in case of up move, or vice versa, sell the open and buy the close, in case of a down move.
Keep in mind DV will NOT foretell you the direction of prices, only the odds of volatility expansion. You need a good momentum/trend indicator (like CI) to detect that. As matter of fact, the combo of CI and DV indicators have shown an unccanny ability to give us a heads up for a potential upcoming big day and its direction.
Comment