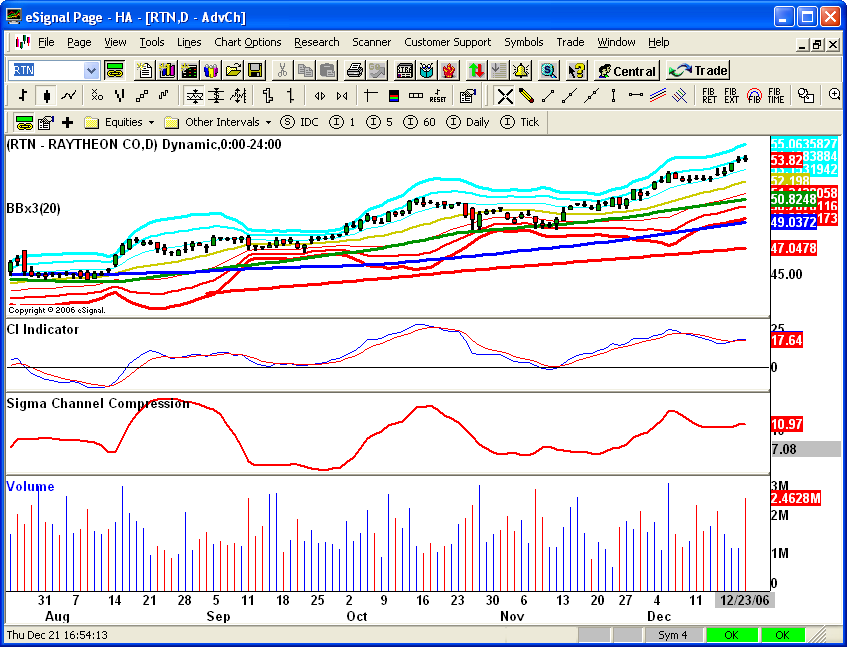
As promised early this month, we are pleased to provide you with our Sigma Channel Compression Indicator for eSignal (in EFS format). The code is set to execute till March 1st, 2007 free of charge. After that you need to be a subscriber to our Proprietary Indicators Package. The code measures the normalized value of distance between +3 sigma and -3 sigma as a unbiased gauge for volatility compression or expansion.
Train your eyes to look for severe channel compression in concert with a fast momentum/trend indicator (of course, here, we are partial to our own CI) as way of detecting both timing and direction of an explosive move in the underlying.
The EFS file can be downloaded to your PC by CLICKING HERE.
Here is a quick note from our Tutorials page:
Sigma Channels
In statistics, Sigma means standard deviation from a mean. In trading, when we say "GOOG is at +2 Sigma," it means Google is trading at 2 standard deviation above its mean, hereinafter its 20 day moving average (i.e., it is at Upper Bollinger Band). As avid students of volatility, we monitor prices using +3, +2, +1, -1, -2 and -3 Sigma Channels. This method tells us how "stretched" the prices are. A good long trade normally is when prices move between +1 and +2 Sigma Channels. Conversely, a good short trade normally is when prices move between -1 and -2 Sigma Channels.
Sigma Bands Probability of Stock Price Travel
+1 to -1 68%
+2 to -2 95%
+3 to -3 99.75%
Here is how it should look like once you apply it to your favorite stock....mine these days happens to be Raytheon (RTN) !!
Comment