Hi guys,
I have been trying to write a code to have lines added to my chart automatically but I just can’t get it to work. I would be very thankful for any help.
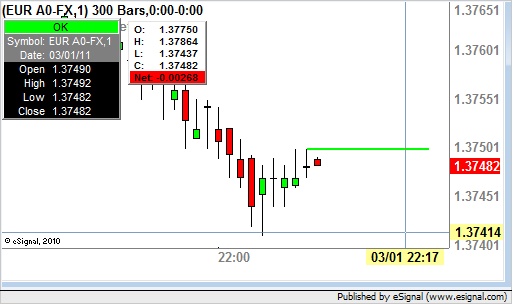
What I am trying to do is to have 2 horizontal lines, about ½ inch long, at the top and at the bottom of each candle that just closed. When the next period candle is still forming, those lines would stay in that previous candle, and when that next candle closes, then the lines would update to that new candle and so on. So the lines would always be from the previous period, signaling where the high and the lows of that previous candle were.
I have an image attached, thank you in advance for your attention.
Roberto


Comment