Announcement

Collapse
No announcement yet.

What step are required activate integrated broker (FXCM).

Collapse
X
 
  • Filter
  • Time
  • Show
Clear All
new posts

  • What step are required activate integrated broker (FXCM).

    I have several strategies developed and tested using the back tester currently using the strategy object to simulate trades.

    Can you tell me what steps are involed to have these trades sent to my broker (FXCM) in real time. I've done some searches and understand a plug-in has to be installed. What options need to be specified in the Trade-Preferences options?

    Are there any code changes needed to my efs strategy files specifically for real-time trading vs. back testing?
    Glen Demarco
    [email protected]

  • #2
    Hello demarcog,

    Please review the following article from our eSignal KnowledgeBase for Integrating eSignal with FXCM.

    In the Trade-Preferences menu, set FXCM to be the default broker.

    Regarding formula code, you will need to write a new version of your formula for processing real-time data. The Strategy Object is intended for back testing with the Strategy Analyzer only. Within the real-time version of your EFS, you can integrate the trades to the broker through the Generic Broker functions. Or you can place the trades manually when a signal is generated by your formula.
    Jason K.
    Project Manager
    eSignal - an Interactive Data company

    EFS KnowledgeBase
    JavaScript for EFS Video Series
    EFS Beginner Tutorial Series
    EFS Glossary
    Custom EFS Development Policy

    New User Orientation

    Comment


    • #3
      Jason,

      Thanks for pointing me to the article. As a first step I would like to manually execute the trades based on my EFS strategies, loaded and run in realtime and setting the background color to signal a trade entry.

      One problem is that I am evaluating my entry position based on the current bar, and using MARKET.NEXTBAR. In the past I have had problems where the background wouldn't change colors until I realoaded the formula as I understand that the value for MARKET.NEXTBAR doesn't exist unless the study is reloaded.

      I also don't want to bar colors alternating as the condition changes intrabar.

      Can you suggest modifications to my backtesting script so I can manually enter the orders until I get the generic broker functions incorporated?
      Glen Demarco
      [email protected]

      Comment


      • #4
        Hello demarcog,

        Originally posted by demarcog
        Jason,

        Thanks for pointing me to the article. As a first step I would like to manually execute the trades based on my EFS strategies, loaded and run in realtime and setting the background color to signal a trade entry.

        One problem is that I am evaluating my entry position based on the current bar, and using MARKET.NEXTBAR. In the past I have had problems where the background wouldn't change colors until I realoaded the formula as I understand that the value for MARKET.NEXTBAR doesn't exist unless the study is reloaded.

        I also don't want to bar colors alternating as the condition changes intrabar.

        Can you suggest modifications to my backtesting script so I can manually enter the orders until I get the generic broker functions incorporated?
        What you need to do is look for BARSTATE_NEWBAR with getBarState(). At this instance, which will be the first trade of a new bar in real time, evaluate your conditions on the bar that just closed, which is bar index -1. If the trade condition is true use setDefaultBarBgColor(). This process in real time reproduces the back testing logic where your formula evaluates the current bar (which is closed, so the close is known) and then records the trade at the open of the next bar. The newbar state only occurs at the open of the current bar, so you will not get the alternating colors intrabar.

        If you are using any of the .isLong(), .isShort() or .isInTrade() methods of the Strategy Object, create a global variable called vPosition and set it 1, 0 or -1 to indicate if your system is long, flat or short, respectively. Then replace any of your conditions that were using the Strategy methods with a condition that checks for the value of vPosition instead.
        Jason K.
        Project Manager
        eSignal - an Interactive Data company

        EFS KnowledgeBase
        JavaScript for EFS Video Series
        EFS Beginner Tutorial Series
        EFS Glossary
        Custom EFS Development Policy

        New User Orientation

        Comment


        • #5
          Originally posted by JasonK
          Hello demarcog,


          What you need to do is look for BARSTATE_NEWBAR with getBarState(). At this instance, which will be the first trade of a new bar in real time, evaluate your conditions on the bar that just closed, which is bar index -1. If the trade condition is true use setDefaultBarBgColor(). This process in real time reproduces the back testing logic where your formula evaluates the current bar (which is closed, so the close is known) and then records the trade at the open of the next bar. The newbar state only occurs at the open of the current bar, so you will not get the alternating colors intrabar.

          If you are using any of the .isLong(), .isShort() or .isInTrade() methods of the Strategy Object, create a global variable called vPosition and set it 1, 0 or -1 to indicate if your system is long, flat or short, respectively. Then replace any of your conditions that were using the Strategy methods with a condition that checks for the value of vPosition instead.

          Jason,


          I'm using the older PROFIT_TARGET samples as a template for my backtesting strategies (although would like to convert them to the more current DONCHAIN_POSITIONMGMT style your code?).

          I have since changed the logic for opening new trades to in the backtesting strategies CLOSE-THISBAR as it enabled me to keep in place the logic I had for the trailingstop, profit target, trade price recording and logic for signal entry/exits that enabled me to get acccurate backtesting results (not a trivial task for some of us).

          Is it better to use MARKET-NEXTBAR in backtesting instead of CLOSE-THISBAR, the price difference intraday for liquid instruments is insignificant?, unlike the MARKET-THISBAR (which is really OPEN).

          If I do use MARKET.NEXTBAR, do I then have to readjust the bar index by -1 for all my profittaget, trailingstops, open, close, and in my signal indicator indices.?

          When I do this in the backtested it really kills the profit as I'm getting in and out a little too early and too late?

          Hopefully in realtime because BARSTATE_NEWBAR is the first trade of a newbar, (while I think the backtesting only process completed bars regardless of wheteher BARSTATE_NEWBAR is checked for or not), the results will readjust.

          Using the old template, would the test for BARSTATE_NEWBAR, go in the section of code that test's for nTrade, and nSignal or up near main?

          As always, I appreciate all you invaluable assistance and have just this past week made some significant progress thanks in large part to you and Alexis.
          Glen Demarco
          [email protected]

          Comment


          • #6
            Hello demarcog,

            Originally posted by demarcog

            ...

            Is it better to use MARKET-NEXTBAR in backtesting instead of CLOSE-THISBAR, the price difference intraday for liquid instruments is insignificant?, unlike the MARKET-THISBAR (which is really OPEN).
            Market.THISBAR records the entry price at the open of the current bar. This fill bar constant is used for back testing formulas that evaluate the entry conditions on bar -1. If an entry condition evaluates to true on the bar that just closed (bar -1) the next realistic trade price to enter a position would be the open of the current bar. Using Market.NEXTBAR or Market.THISBAR is completely dependant on the formula logic in question. I personally recommend evaluating entry conditions on bar -1 and entering the position on Market.THISBAR. This type of formula logic is easier to convert to a real time version for paper trading or forward testing the strategy.

            If I do use MARKET.NEXTBAR, do I then have to readjust the bar index by -1 for all my profittaget, trailingstops, open, close, and in my signal indicator indices.?
            If you are entering the trades using nextbar, then your profit targets, trailing stops variables could be based on bar 0 if they are not derived by the entry price. If these variable are derived by the entry price you could use open(1) to get that price. However, open(1) only works in back testing because that value is known on a historical basis. In real time open(1) will return null because that trade does not exist yet. This is another reason to avoid nextbar formula logic.

            When I do this in the backtested it really kills the profit as I'm getting in and out a little too early and too late?
            Can't answer this without seeing the formula code.

            Hopefully in realtime because BARSTATE_NEWBAR is the first trade of a newbar, (while I think the backtesting only process completed bars regardless of wheteher BARSTATE_NEWBAR is checked for or not), the results will readjust.
            Right, in back testing, the formula only processes completed bars. Therefore, one execution of the formula code per historical bar. The bar state for all historical bar will be newbar. With back testing formulas you don't even need to look for the bar state. Back testing formulas are based on assumptions. They cannot produce results that would occur in real time. This is another reason why a separate version of the strategy needs to be created for real time analysis. In many cases extra logic needs to be added to process the system on a trade-by-trade basis.

            Using the old template, would the test for BARSTATE_NEWBAR, go in the section of code that test's for nTrade, and nSignal or up near main?
            It all depends on what specific formula you are referring to. I would suggest trying some of these things and see what happens. Many times this process will answer your question.

            As always, I appreciate all you invaluable assistance and have just this past week made some significant progress thanks in large part to you and Alexis.
            You're most welcome.
            Jason K.
            Project Manager
            eSignal - an Interactive Data company

            EFS KnowledgeBase
            JavaScript for EFS Video Series
            EFS Beginner Tutorial Series
            EFS Glossary
            Custom EFS Development Policy

            New User Orientation

            Comment


            • #7
              Originally posted by JasonK


              The newbar state only occurs at the open of the current bar, so you will not get the alternating colors intrabar.

              I have a system I spent weeks programming and tested well in the back tester. When I run it in realtime the trade signals are changing back and forth at times. I'm running it on a 5 min chart, and basing my signals on the 5 min and a longer term time period. Basically I'm trying to do something fairly simple, confirm a signal before taking a trade by verifying that the same condition exists on a higher time frame. In this case if the stochastic K value is higher on the close of this 5 minute bar, and higher on the close of the latest 60 minute bar go long.


              For the sake of simplicity take the following example (which I realize wouldn't make sense as a system but it illustrates the problem.

              vSTDint1 = stochK(5,1,1,inv(5));
              vSTDint2 = stochK(5,1,1,inv(60));

              if( vSTDint1.getValue(-0) > vSTDint1.getValue(-1) &&
              vSTDint2.getValue(-0) > vSTDint2.getValue(-1) ){
              setBarBgColor = Color.Green;
              vPosition = "long";
              }if( vSTDint1.getValue(-0) > vSTDint1.getValue(-1) &&
              vSTDint2.getValue(-0) > vSTDint2.getValue(-1) ){
              setBarBgColor = Color.Green;
              vPosition = "short";
              }

              It appears that the line graphing the stochK value for the longer term stochk changes for the most recent 5 minute bars, and only changed once an hour on bars older then 60 minutes. This causes my real time system to flash red and green. This really was a major disappointment because the system tested so well.

              I ran across this post:

              http://forum.esignalcentral.com/show...3940#post73940

              My first question is this:

              Is the suggestion in that post to use the getSeries function instead of getValue in my test to resolve this problem. I tried this:

              if (getSeries(vStDint2(0)) > getgetSeries(vStDint2(-1))

              it didn't generate a syntax error but never tested as true, because no trades were generated, is this the proper syntax.

              Next Question:

              Is it being suggested that this unusual or at least counter intuitive behavior, "forward looking" of using longer time period intervals within shorter timeframe charts, can actually cause systems to test very profitable in the backtester but actually loose a great deal of money in realtime?? If so that's another major disappointment, and actually a much bigger problem then the MARKET-THISBAR, "forward looking" problem.

              Next Question:

              Using vSTDint2(-1) and vStdint2(-2) when referring to a 60 minute interval basically means ignoring as much as 60 minutes of the most recent, or if using longer term data, like daily, means ignore all of today's price data. The system doesn't perform nearly as well when doing that.

              Last Question:

              Can you offer any suggestions on accomplishing the objective: namely checking an indicator value on a shorter time interval with a longer value as confirmation, without excluding the most recent data?


              Thanks Jason, I appreciate very much all your help and I hope you understand how devastating it is when you think you have something profitable only to find out the backtested results are completely inaccurate..
              Glen Demarco
              [email protected]

              Comment


              • #8
                Hello demarcog,

                Originally posted by demarcog
                I have a system I spent weeks programming and tested well in the back tester. When I run it in realtime the trade signals are changing back and forth at times. I'm running it on a 5 min chart, and basing my signals on the 5 min and a longer term time period. Basically I'm trying to do something fairly simple, confirm a signal before taking a trade by verifying that the same condition exists on a higher time frame. In this case if the stochastic K value is higher on the close of this 5 minute bar, and higher on the close of the latest 60 minute bar go long.


                For the sake of simplicity take the following example (which I realize wouldn't make sense as a system but it illustrates the problem.

                vSTDint1 = stochK(5,1,1,inv(5));
                vSTDint2 = stochK(5,1,1,inv(60));

                if( vSTDint1.getValue(-0) > vSTDint1.getValue(-1) &&
                vSTDint2.getValue(-0) > vSTDint2.getValue(-1) ){
                setBarBgColor = Color.Green;
                vPosition = "long";
                }if( vSTDint1.getValue(-0) > vSTDint1.getValue(-1) &&
                vSTDint2.getValue(-0) > vSTDint2.getValue(-1) ){
                setBarBgColor = Color.Green;
                vPosition = "short";
                }
                The problem with this is that vSTDint1 is looking at bar index of 0. In real time, the .getValue(0) value will be changing based on the change in the price for the bar that is currently developing. This means that during the current interval your conditions could evaluate to true sometimes and false others depending on the price of the last trade, which is not the close of the bar. There is no way to know which trade is going to be the last trade for the bar until the open of the following bar. Referencing bar index of 0 for real time analysis can create whipsaw, or false signals. The only way to get a confirmed evaluation of a trade signal is by looking at the most recently completed bar. The instance in which this can be evaluated is at the open of the current bar, or BARSTATE_NEWBAR.

                When dealing with a multiple time frame formula, you can do this a couple different ways. You can evaluate the signals at the open of the 5 minute interval that your chart is running on. In this case put your signals inside a check for newbar like so.

                if (getBarState() == BARSTATE_NEWBAR) {
                // your trade conditions
                }

                All of your series reference should be looking at bar -1 for both vSTDint1 and vSTDint2. This will look for a new trade signal once every 5 minutes.

                If you only want to evaluate the signal at the close of each 60 minute bar, then do the same as above but look for newbar of the 60 minute interval. Again, all series bar index references should be looking at bar -1.

                if (getBarStateInterval("60") == BARSTATE_NEWBAR) {
                // your trade conditions
                }


                It appears that the line graphing the stochK value for the longer term stochk changes for the most recent 5 minute bars, and only changed once an hour on bars older then 60 minutes. This causes my real time system to flash red and green. This really was a major disappointment because the system tested so well.
                Remember that when a formula loads it only processes completed bars. This is true for the 60 min interval series as well. The historical plots are stair-stepped across the 60 minute window on the 5 minute chart because only the close of each 60 minute bar is used. If you want to maintain the same stair-stepped plot of the 60 minute series wrap the series variable with getSeries() in your return statement.

                return new Array(vSTDint1.getValue(0), getSeries(vSTDint2));

                The red/green flashing is most likely due to the bar index references of 0 in your example above. This is the example of false signals I was previously referring to.

                I ran across this post:

                http://forum.esignalcentral.com/show...3940#post73940

                My first question is this:

                Is the suggestion in that post to use the getSeries function instead of getValue in my test to resolve this problem. I tried this:

                if (getSeries(vStDint2(0)) > getgetSeries(vStDint2(-1))

                it didn't generate a syntax error but never tested as true, because no trades were generated, is this the proper syntax.
                This is improper usage of getSeries(). It is should be used in the return statement as Alex showed and as I explained above.

                Your code example should look like the following and again, should be referencing only completed bars to avoid the false signals.

                if (vSTDint2.getValue(-1) > vSTDint2.getValue(-2) )


                Next Question:

                Is it being suggested that this unusual or at least counter intuitive behavior, "forward looking" of using longer time period intervals within shorter timeframe charts, can actually cause systems to test very profitable in the backtester but actually loose a great deal of money in realtime?? If so that's another major disappointment, and actually a much bigger problem then the MARKET-THISBAR, "forward looking" problem.
                This forward looking aspect of back testing is simply the nature of the multiple time frame logic caused by referencing bar indexes of 0 rather than the most recently completed bar, or bar indexes of -1. On a historical basis, EFS only processes completed bars. If your back testing on a 5 minute chart, the EFS processes once per 5 minute bar. When the 5min bar that has the same time stamp as the 60min bar is evaluated (time stamps represent the start time of the bar), the close for both bars is known and will be used if your code logic asks for bar index of 0. However, the close of the 60min bar is roughly 55 minutes into the future. This is what creates the forward looking logic. Your formula is trying to evaluate a condition 5 minutes into the 60 min bar. This type of logic cannot create realistic results as a result. If your logic is always looking at bar -1 for each interval, then you will have sound logic and realistic results.

                Next Question:

                Using vSTDint2(-1) and vStdint2(-2) when referring to a 60 minute interval basically means ignoring as much as 60 minutes of the most recent, or if using longer term data, like daily, means ignore all of today's price data. The system doesn't perform nearly as well when doing that.
                Again, this is simply the nature of trading multiple time frames. If you want to take a trade based on the 60 min interval before the 60 min interval is closed, you certainly can. However, the trade could be based on a false signal as the condition may evaluate to false by the time that 60 min interval closes. To back test a system that is based on intra-bar signals requires that you incorporate some assumptions into the code because on a historical bases EFS cannot see each trade within a bar, only the open, high, low and close. If you go this route you cannot record a trade with MARKET/THISBAR unless it is the open of the bar that triggers the trade. Otherwise, use STOP/THISBAR or LIMIT/THISBAR.

                Last Question:

                Can you offer any suggestions on accomplishing the objective: namely checking an indicator value on a shorter time interval with a longer value as confirmation, without excluding the most recent data?
                Not without allowing a trade to be based on a potentially false signal.


                Thanks Jason, I appreciate very much all your help and I hope you understand how devastating it is when you think you have something profitable only to find out the backtested results are completely inaccurate..
                You're most welcome. Keep in mind that back test results are a direct consequence of the formula logic that is used. I hope that the information you receive here from myself and others is helpful to your progress.
                Jason K.
                Project Manager
                eSignal - an Interactive Data company

                EFS KnowledgeBase
                JavaScript for EFS Video Series
                EFS Beginner Tutorial Series
                EFS Glossary
                Custom EFS Development Policy

                New User Orientation

                Comment


                • #9
                  Originally posted by JasonK
                  You're most welcome. Keep in mind that back test results are a direct consequence of the formula logic that is used. I hope that the information you receive here from myself and others is helpful to your progress.
                  You have all been a tremendous help, and I appreciate it very much.

                  I ran across this post http://forum.esignalcentral.com/show...threadid=19373 but not sure if it is applicable . Another possibility in a another post that you responded to where they were interested in looking at the 30 minute stochastics from within the 5 minute chart, and simple multiplied the 14,3,3 to 84, 3, 3) or something similar (don't have the post link).

                  One thing I noticed is that if you bring up a 5 minute chart while plotting the display for the 5, 60, and 240 minute (5,20 ) priice oscillator values, the values plotted don't match the oscillator values in the actual 60minute, and 240 minute chart with the same 5,20 price oscillator.

                  Also when those values are plotted after a a certain number of intervals the values seem to converge and seem to be altered with each tick occurring on the 5 minute chart which I really don't understand. How a single tick in a 5 minute chart can have such a large impact on a longer term 60 and 240 minute?

                  I include a portion of the program which plots the longer term oscillators and if you look at those oscillators on the longer term charts the values are way out of line, and idea what I'm doing wrong?
                  Attached Files
                  Glen Demarco
                  [email protected]

                  Comment


                  • #10
                    Hello demarcog,

                    Originally posted by demarcog
                    You have all been a tremendous help, and I appreciate it very much.

                    I ran across this post http://forum.esignalcentral.com/show...threadid=19373 but not sure if it is applicable .
                    You need to provide more specifics as I'm not sure what you are referring to.


                    Another possibility in a another post that you responded to where they were interested in looking at the 30 minute stochastics from within the 5 minute chart, and simple multiplied the 14,3,3 to 84, 3, 3) or something similar (don't have the post link).
                    This can also be used, but keep in mind that this is not a true multiple time frame solution. This method really is only a comparison to the same interval with different lengths specified for multiple stochastic series.


                    One thing I noticed is that if you bring up a 5 minute chart while plotting the display for the 5, 60, and 240 minute (5,20 ) priice oscillator values, the values plotted don't match the oscillator values in the actual 60minute, and 240 minute chart with the same 5,20 price oscillator.
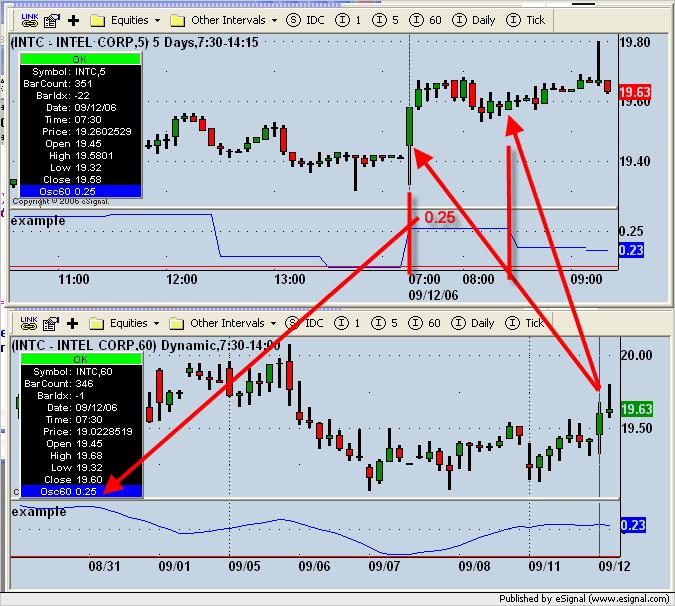
                    Sure they do. You may just not understand what you're looking at. Take a look at the following image. The top chart is a 5 min chart that is plotting, osc( 10, 21, false, inv(60) ), which is based on the 60 min interval. The bottom chart is a 60 min chart plotting the same study.


                    The two arrows drawn from the 60min chart up to the 5min chart are pointing to the first and last 5 minute bar that corresponds to the 60 min bar below. The value for the osc in the 5min chart for all 12 bars that fall within the corresponding 60 min bar is 0.25. Notice also in the 60 min chart that the value for the same 60 minutes is also 0.25. Remember that historical bars are processed as completed bars. On the 5 min chart there is only one available value for each 60min bar for the osc study, which is based on the closing value of the 60 min interval.

                    Here's the code that was used for the image above.

                    PHP Code:
                    function preMain() {
                        
                    //setPriceStudy(true);
                        
                    setStudyTitle("example");
                        
                    setCursorLabelName("Osc60"0);
                    }

                    var 
                    xOsc null;

                    function 
                    main() {
                        if (
                    xOsc == nullxOsc osc1021falseinv(60) ); 
                        
                        var 
                    nOsc xOsc.getValue(0);
                        if (
                    nOsc == null) return;

                        return 
                    getSeries(xOsc);

                    Also when those values are plotted after a a certain number of intervals the values seem to converge and seem to be altered with each tick occurring on the 5 minute chart which I really don't understand. How a single tick in a 5 minute chart can have such a large impact on a longer term 60 and 240 minute?
                    In real time, the study is processed on a tick-by-tick basis, which is why the plot for a higher time frame study does not maintain it's stair-stepped appearance that is plotted on historical bars where the bars are only processed on a completed basis. At least I think this is what you are referring to. If not, please explain further and post some chart images to help illustrate what you are referring to.

                    If you want the real time plot to match the historical stair-stepped appearance, wrap the higher time frame series in your return statement with getSeries().

                    Example:

                    return new Array( getSeries(vOSCint1) , getSeries(vOSCint2), getSeries(vOSCint3) );


                    I include a portion of the program which plots the longer term oscillators and if you look at those oscillators on the longer term charts the values are way out of line, and idea what I'm doing wrong?
                    You're not doing anything wrong in your code. It's just a matter of looking at the values of the bars between the charts that correspond with each other. If it's the real time plot that you're having trouble with, use the return statement above and see if that helps.
                    Jason K.
                    Project Manager
                    eSignal - an Interactive Data company

                    EFS KnowledgeBase
                    JavaScript for EFS Video Series
                    EFS Beginner Tutorial Series
                    EFS Glossary
                    Custom EFS Development Policy

                    New User Orientation

                    Comment

                    Working...
                    X