 Tweet
Tweet
In Depth With Market Depth
As electronic trading begins to truly take hold in equity and future markets around the world, the tools that level the playing field between the pit-trader and the screen-based trader are becoming more and more important. In recent years, primarily during the dot-com boom, one of these tools that received an exorbitant amount of attention was NASDAQ Level II window (now known as NASDAQ Montage). Now as we move through today’s topic, we’ll expand our scope of Market Depth to include the other various types of Market Depth information, but for now, let’s start with some basic concepts and terminology.
To begin with, what exactly is Market Depth? Well, when we think back to some of the terms that we covered in the final Traders Corner of 2005, we talked about specifically about the bid and ask. Knowing what the bid and ask are, is part of the Market Depth story, but knowing how the bid and ask interact with one another is equally important. The Market Depth window is designed to show traders where the trading interest lies at a particular price level. It illustrates where institutions, other traders and even some market makers are willing to buy or sell a particular security. In a nutshell, the Market Depth window shows us the current depth of a particular stock, future or option contract. Ok, why is trading depth of a particular security important? If we think about supply and demand in its purest form, two key ideas come to mind.
1. If supply is low and / or demand is high, it raises the inherent value of the object. (Price goes up)
2. If supply is high and / or demand is low, it lowers the inherent value of the object. (Price goes down)
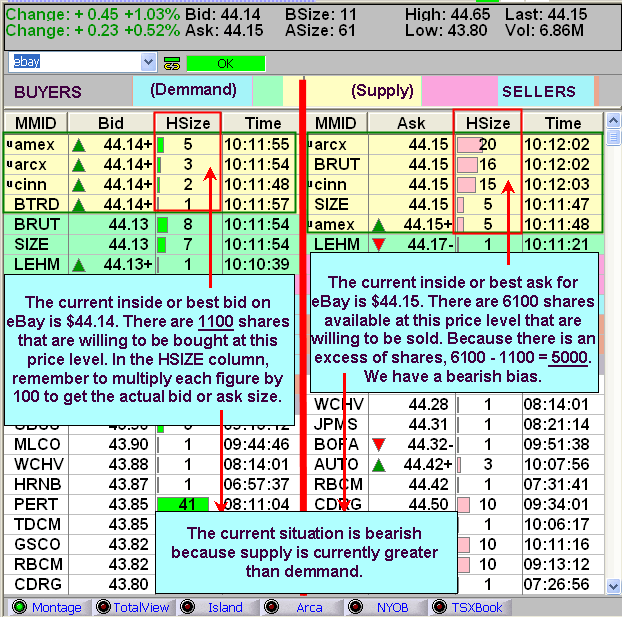
To properly explain some of the practical trading concepts behind Market Depth, we need to have an understanding about what it is we see when the Market Depth window is open. Below is an example of the market depth for EBAY. At the time this example was illustrated, the sellers were in control of the situation. On the right-hand side of the Market Depth window, we can see that there were many more shares willing to be sold compared to the amount of shares that were willing to be bought (the left-hand side of the window). At that current moment, supply was greater than demand, hence the price action moved down slightly as the sellers maneuvered themselves to get their orders filled. If we switched the view of the market depth and had more shares on the buy side, we could conclude that demand would, for a moment outweigh supply and could drive the price upward.
Understanding market depth is quite similar to understanding the strategies behind a game of poker. As traders are always looking to position themselves in the best possible way, we may often see traders buy the inside ask to insure a long trade is filled or inversely, a seller will sell the inside bid to exit an existing long position or initiate a short position. By doing this, traders may be willing to sacrifice the spread between the inside bid and inside ask.
Because the Market Depth window is comprised of bid and ask quotes only, it is possible to manipulate the price action both intentionally and unintentionally. This happens primarily when trading lower volume stocks or presenting large orders to the market.
Let’s work with a real world example. Stock XYZ has a daily volume of approximately 100,000 shares. This is considered somewhat low as many large cap stocks typically trade several million shares per day. We are looking to buy 5000 shares of stock XYZ. This should be considered a large order as it accounts for 5% of the daily average volume. The current inside bid and ask for stock XYZ is $4.50 x $4.60. We now have a $.10 spread. We place our buy order for 5000 shares at $4.50. Being that we have brought a large order to the market, we can say that demand is now significantly higher. As other institutions, traders and market players see this order they notice that someone has created demand. The sellers at $4.60 feel that the price is going up and they may be able to get more for their shares. They cancel their outstanding orders and move the inside ask to $4.75. We now have a $.25 spread. Other traders who also want to buy stock XYZ feel that the stock may be moving up before their orders are filled so they move ahead of our order by placing a buy order at $4.60. The spread is now $.15. Just by presenting our large order to the market, we moved the trading from $4.60 to $4.75 even though our order was never filled. We continue to readjust our order to higher and higher prices creating the impression of increased demand. As the stock continues to move higher, we are manipulating our bid and thereby manipulating the price. Some traders will do this intentionally; some traders may be unaware of why the price continues to be just pennies away from their grasp. It should be noted that this strategy is very risky and can backfire if they are simply placing orders to manipulate the price action.
The depth of the market has always been a controlling factor in supply and demand. Prior to the dot-com boom, the SOES Bandits, (a group of traders who made money daily by simply manipulating the bid and ask in rapid succession for small amounts of profits several times a day), would take small positions (under 1000 shares) and quickly sell them back to the institutions they just purchased them from, keeping the difference.
Earlier we mentioned NASDAQ Level II or NASDAQ Montage. Let’s take a moment and explore some of the other types of market depth display.
NASDAQ Total View: Similar to the Montage view with the primary difference being that a market maker can be listed at more that one price level. This allows traders to see if a particular institution has more than one buy or sell order and how many shares they will be buying or selling at each respective level.
New York Open Book: The NYOB or New York Open Book is the market depth for the New York Stock Exchange. Stocks that are not listed on this exchange will not display data under this view. One of the primary differences between the NASDAQ market depth and the NYOB, is that the NYOB will not show the MMID or Market Maker Identification code under the MMID column.
ECN (Electronic Communication Network): An ECN or Electronic Communication Network is a "mini-exchange" that displays the quote activity for a variety of stocks. ECN's typically display their respective data in the form of a Market Depth window. Prior to 2001, there were seven independent ECN's. Due to consolidation, there are now two major ECN's in the domestic equity markets. The two ECN's provided in eSignal are INET and ARCA, known as Island and Archipelago respectively.
As electronic trading begins to truly take hold in equity and future markets around the world, the tools that level the playing field between the pit-trader and the screen-based trader are becoming more and more important. In recent years, primarily during the dot-com boom, one of these tools that received an exorbitant amount of attention was NASDAQ Level II window (now known as NASDAQ Montage). Now as we move through today’s topic, we’ll expand our scope of Market Depth to include the other various types of Market Depth information, but for now, let’s start with some basic concepts and terminology.
To begin with, what exactly is Market Depth? Well, when we think back to some of the terms that we covered in the final Traders Corner of 2005, we talked about specifically about the bid and ask. Knowing what the bid and ask are, is part of the Market Depth story, but knowing how the bid and ask interact with one another is equally important. The Market Depth window is designed to show traders where the trading interest lies at a particular price level. It illustrates where institutions, other traders and even some market makers are willing to buy or sell a particular security. In a nutshell, the Market Depth window shows us the current depth of a particular stock, future or option contract. Ok, why is trading depth of a particular security important? If we think about supply and demand in its purest form, two key ideas come to mind.
1. If supply is low and / or demand is high, it raises the inherent value of the object. (Price goes up)
2. If supply is high and / or demand is low, it lowers the inherent value of the object. (Price goes down)
To properly explain some of the practical trading concepts behind Market Depth, we need to have an understanding about what it is we see when the Market Depth window is open. Below is an example of the market depth for EBAY. At the time this example was illustrated, the sellers were in control of the situation. On the right-hand side of the Market Depth window, we can see that there were many more shares willing to be sold compared to the amount of shares that were willing to be bought (the left-hand side of the window). At that current moment, supply was greater than demand, hence the price action moved down slightly as the sellers maneuvered themselves to get their orders filled. If we switched the view of the market depth and had more shares on the buy side, we could conclude that demand would, for a moment outweigh supply and could drive the price upward.
Understanding market depth is quite similar to understanding the strategies behind a game of poker. As traders are always looking to position themselves in the best possible way, we may often see traders buy the inside ask to insure a long trade is filled or inversely, a seller will sell the inside bid to exit an existing long position or initiate a short position. By doing this, traders may be willing to sacrifice the spread between the inside bid and inside ask.
Because the Market Depth window is comprised of bid and ask quotes only, it is possible to manipulate the price action both intentionally and unintentionally. This happens primarily when trading lower volume stocks or presenting large orders to the market.
Let’s work with a real world example. Stock XYZ has a daily volume of approximately 100,000 shares. This is considered somewhat low as many large cap stocks typically trade several million shares per day. We are looking to buy 5000 shares of stock XYZ. This should be considered a large order as it accounts for 5% of the daily average volume. The current inside bid and ask for stock XYZ is $4.50 x $4.60. We now have a $.10 spread. We place our buy order for 5000 shares at $4.50. Being that we have brought a large order to the market, we can say that demand is now significantly higher. As other institutions, traders and market players see this order they notice that someone has created demand. The sellers at $4.60 feel that the price is going up and they may be able to get more for their shares. They cancel their outstanding orders and move the inside ask to $4.75. We now have a $.25 spread. Other traders who also want to buy stock XYZ feel that the stock may be moving up before their orders are filled so they move ahead of our order by placing a buy order at $4.60. The spread is now $.15. Just by presenting our large order to the market, we moved the trading from $4.60 to $4.75 even though our order was never filled. We continue to readjust our order to higher and higher prices creating the impression of increased demand. As the stock continues to move higher, we are manipulating our bid and thereby manipulating the price. Some traders will do this intentionally; some traders may be unaware of why the price continues to be just pennies away from their grasp. It should be noted that this strategy is very risky and can backfire if they are simply placing orders to manipulate the price action.
The depth of the market has always been a controlling factor in supply and demand. Prior to the dot-com boom, the SOES Bandits, (a group of traders who made money daily by simply manipulating the bid and ask in rapid succession for small amounts of profits several times a day), would take small positions (under 1000 shares) and quickly sell them back to the institutions they just purchased them from, keeping the difference.
Earlier we mentioned NASDAQ Level II or NASDAQ Montage. Let’s take a moment and explore some of the other types of market depth display.
NASDAQ Total View: Similar to the Montage view with the primary difference being that a market maker can be listed at more that one price level. This allows traders to see if a particular institution has more than one buy or sell order and how many shares they will be buying or selling at each respective level.
New York Open Book: The NYOB or New York Open Book is the market depth for the New York Stock Exchange. Stocks that are not listed on this exchange will not display data under this view. One of the primary differences between the NASDAQ market depth and the NYOB, is that the NYOB will not show the MMID or Market Maker Identification code under the MMID column.
ECN (Electronic Communication Network): An ECN or Electronic Communication Network is a "mini-exchange" that displays the quote activity for a variety of stocks. ECN's typically display their respective data in the form of a Market Depth window. Prior to 2001, there were seven independent ECN's. Due to consolidation, there are now two major ECN's in the domestic equity markets. The two ECN's provided in eSignal are INET and ARCA, known as Island and Archipelago respectively.