Announcement

Collapse
No announcement yet.

Advanced Charting Methods & Ideas

Collapse
X
 
  • Filter
  • Time
  • Show
Clear All
new posts

  • #91
    Geometry Update of Mid July Chart

    Charting of 07/19/03 "No, this is NOT a G222 Bullish"


    Today's UPDATE

    Fabrizio L. Jorio Fili

    Comment


    • #92
      HARMONIC NUMBER #11

      FROM 07/31 DOWN TO THE LOW SWING OF TODAY

      11 BARS OF 60 MIN. BOUNCING ON AN AGGRESSIVE ELLIPSE


      Fabrizio L. Jorio Fili

      Comment


      • #93
        Perspectives & Similarity

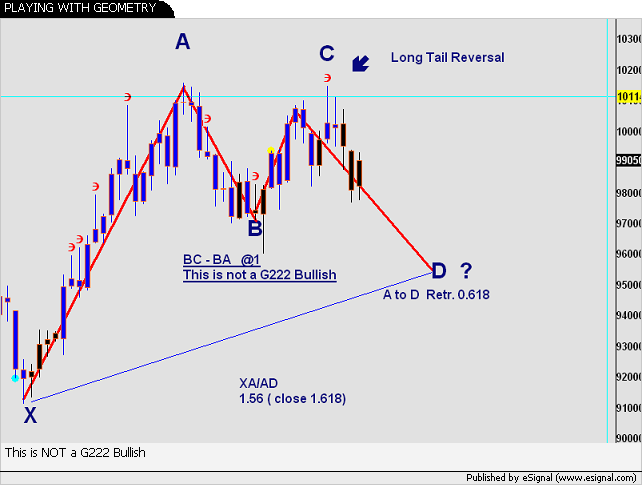
        I see the potenial for a large upside move
        but am always attempting to maintain some reason.
        I'm sure some fundamentalists are confused on some
        market valuations. TA can be equally treacherous

        Two different perspectives yet similar.


        Last edited by JJordan; 08-04-2003, 02:37 PM.

        Comment


        • #94
          Market weakness and trend changes

          Many stocks are struggling to hold gains
          others are in retracement.

          Comment


          • #95
            Trends & Momentum change

            Doji know that's true?

            Comment


            • #96
              Impulsive on 35 and then little SAR

              Fabrizio L. Jorio Fili

              Comment


              • #97
                channel breaks

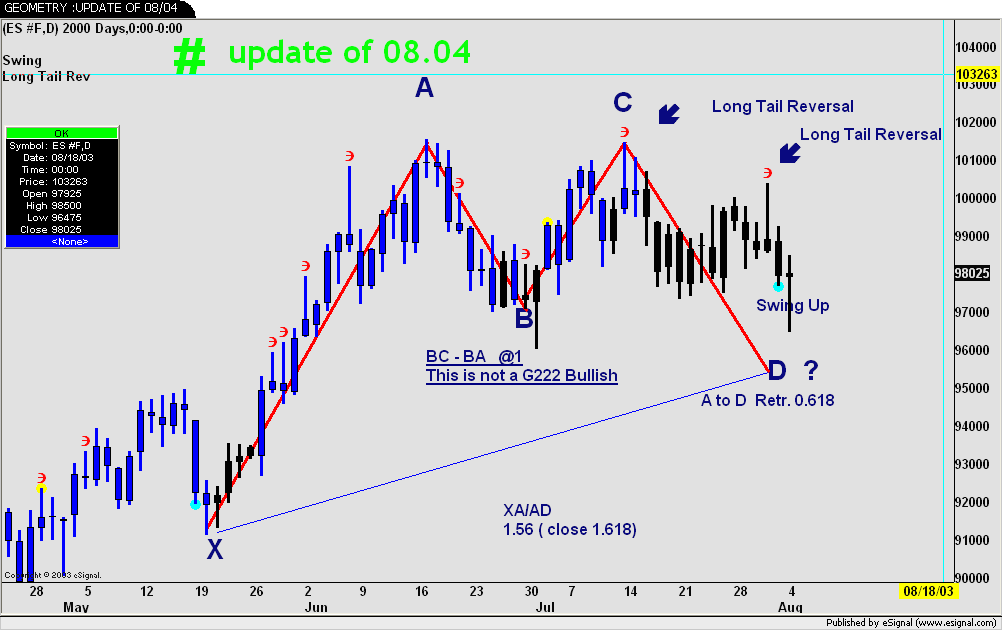
                My what a large cluttered chart you have.<g>
                My bad habits are catching?

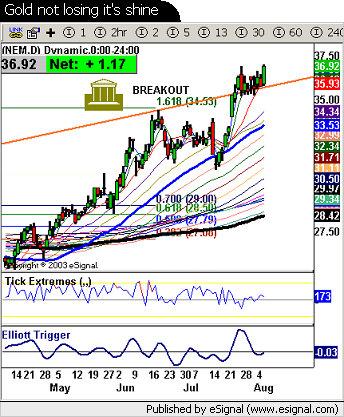
                I see the price fall out of your channel. I'm
                wondering what the spike is on that indicator
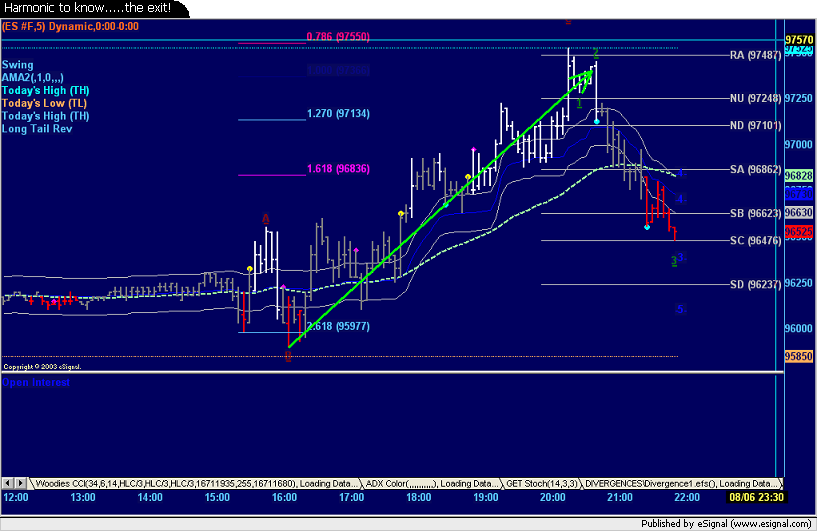
                formula study? (TO) I see your harmonic target met.
                I see the SAR crosses, I think?

                I attached chart below:
                Thanks , what a day!

                ~j
                Attached Files
                Last edited by JJordan; 08-05-2003, 01:47 PM.

                Comment


                • #98
                  Re: channel breaks

                  JJ

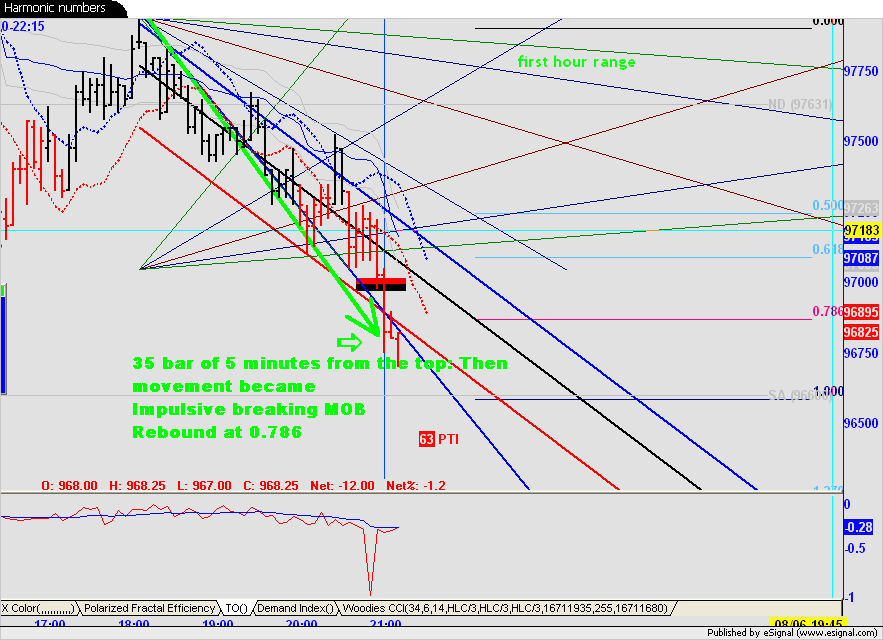
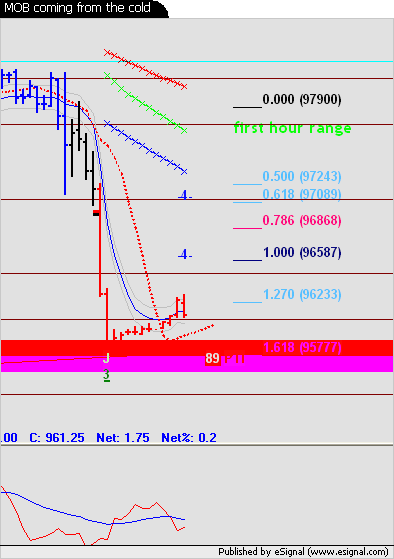
                  You are right, , sorry about it. Very cluttered and poor in description.
                  Howevere You just pointed out: Breaking the lower part of RC, at the 35 bar gaining momentum an d Breaking the MoB, Breaking the 3X1 supporting.
                  But.........there is a nice MOB tested down there, look :


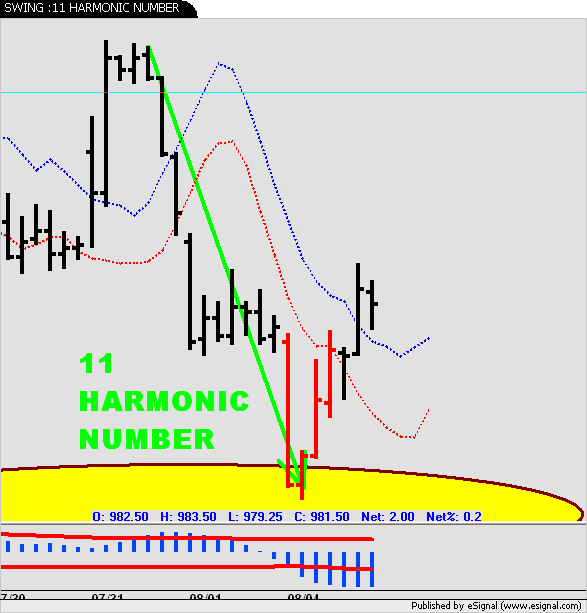
                  The oscillator you see is a THRUST Osc. (home made from S&C)

                  Has been a very nice day, it is true and I taking some satisfactions in charting (well money is secondary pfuiii, ehehehe).......later today I'll post you why even if I'm not right).

                  PS: you see OHLC2 with +0.2% because this cahrt is made on Globex this morning
                  Last edited by fabrizio; 08-06-2003, 04:57 AM.
                  Fabrizio L. Jorio Fili

                  Comment


                  • #99
                    Let the charts do the talking

                    Traders para-dice!<g>

                    Comment


                    • Intraday swings and ranges

                      It's good for traders the market can swing...keeps everyone more honest.
                      Here's another view of the crime scene..<g>
                      TA/ note: 2 bars parabolic dots

                      Last edited by JJordan; 08-06-2003, 09:54 AM.

                      Comment


                      • Bar charts provide unique view of market

                        The weekly chart suggests traders should be careful
                        of whipsaw moves during direction changes. I'm
                        watching the price break upper BB and waiting on
                        the 3, setback 3ma to breach or bounce....price to centerline
                        or the herd will be waiting for you.<g>

                        Comment


                        • Glitter

                          Sometimes if it glitters it is gold.<g> Breakout follow-up

                          Comment


                          • Another beautiful Doji Day

                            Doji=volatility

                            Comment


                            • Follow the trades/market

                              Volatility leads to opportunity for the trader.
                              Use the charts....

                              Comment


                              • HARMONIC........ TO HELP THE EXIT!

                                I can only ytry to evaluate the next five days opportunities . And it's mandatory to reduce the risk . At my level I can do Nothing else.

                                Harmonic gives a great help in making my trades profitables and confirm (support?) my exit plans .
                                Good days.


                                Last edited by fabrizio; 08-06-2003, 02:24 PM.
                                Fabrizio L. Jorio Fili

                                Comment

                                Working...
                                X