Announcement

Collapse
No announcement yet.

Advanced Charting Methods & Ideas

Collapse
X
 
  • Filter
  • Time
  • Show
Clear All
new posts

  • #61
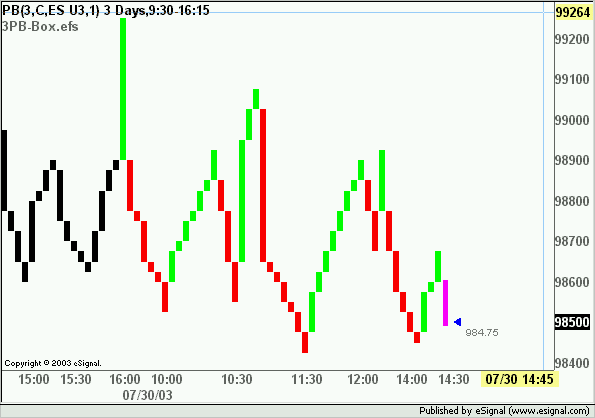
    Are the dips still being bot?

    The strategy that got the market here has been buy the dips.
    For demonstation only I posted GE. If a trader was following that
    strategy money should start supporting the stock in the green area.
    It works until it doesn't<g> Demonstration only light vol...

    Comment


    • #62
      The market looks weak light volume

      Just taking a look from a different perspective.
      .....going nowhere in the noise?

      Comment


      • #63
        Looks aweful&lt;g&gt; find beauty beyond the skin?

        Hi Linus,

        I have tweaked to see what it does...
        I have tweeked the blue bollinger bands

        Focus on the inner channel to see where the action is.

        I noticed my bollingers are interacting with whatever
        that efs is.....but, I see things.

        But, I'm a druid at heart.

        Remember, if you can't take it apart you can't find
        how it goes back together....what have you learned?

        Then, again it's doesn't have to work? But this is doing
        something. You can see the trades. Interaction between
        price(gold) and BB centerline (which is 20ma) the outside
        bands react excitedly at events.

        Some of my charts are just exercises. I think outloud.

        The Kirshenbaum efs is in specialty Lib/misc.


        ~j
        Last edited by JJordan; 07-28-2003, 01:59 PM.

        Comment


        • #64
          Renko chart excitement today

          Thanks Linus,

          That's an excellent chart!
          I see the renko charts saw some action today?


          Nice little shake rattle and roll....

          Comment


          • #65
            3 line price break

            As a follow-up chart I used the 3 line price break chart.
            Some traders use these on 1min ,3min charts etc.
            It clearly shows the move in CEGE

            Of course my MA envelope is at work always.
            3LB or 3PB or 3LPB is not time based but priced based chart.

            Last edited by JJordan; 07-29-2003, 01:18 PM.

            Comment


            • #66
              Trading Futures, etc/

              Everyone is beginning to get interested in daytrading
              futures contracts. Many brokers are now offring low cost
              e-mini contracts. I know lots of traders that scalp stochastics
              on 1min.- 2min charts. The choppy markets makes for trades.
              Yesterday certainly had some money making moves.

              ~j

              Comment


              • #67
                Along the lines of the Renko-Box.efs I posted earlier here is one that performs a similar task with the 3PB/3LB chart.
                If someone wishes to modify and/or improve upon the idea/code they are welcome to do so.
                Alex

                Attached Files
                Last edited by ACM; 07-30-2003, 12:17 PM.

                Comment


                • #68
                  Make up your mind: Big Mac or Chicken Mc Nuggets?(Ergo:what approach you follow?)

                  Take it as a JOKE and have some fun!! I hope.
                  Why Not This? Quoting Shes ,
                  Unless one has seen it in action (accurately that is) it may sound foreign and useless. So before sounding out please take a look at what you might be missing and then come up with a reasoned case.
                  all the people who do not know AL LARSON Real Time CHAOS PROGRAM do not know what they miss! At least try it and then discuss!
                  +green Tide, but squashed
                  +Tide 32 nailed the sharp drop

                  Win2Day: +2.5,-1,-1,-2,+9.5 the way I did them

                  I was too aggressive in the flat section.
                  But I stuck with the trading plan, kept my losses small,
                  did not get frustrated, and was available
                  when the market finally offerered some profits.

                  Tomorrow:
                  I expect follow through of this afternoon's decline
                  The early part of the basic MoonTide does not show that big of a range, but Tide32 shows a steady morning move
                  Prices: all +/- multiples of 18 points
                  Neptune: 998,980 -set today's high and low and timed the drop
                  Saturn/Moon: 991.25
                  Uranus:984.25
                  Pluto/Moon: 988
                  TideTimes: 9:20-9:40 (wait for outcry opening), 10:50,11:50,1:36,3:20 Natural Times: ,9:08,9:56**,10:40*,11:03,12:04*,12:33,12:57,13:16 ,13:41,14:13,15:07*,15:55,
                  16:39
                  Strategy: Trade the Tide turns near 9:40, 11:50, and 1:36
                  Last edited by fabrizio; 07-31-2003, 04:55 AM.
                  Fabrizio L. Jorio Fili

                  Comment


                  • #69
                    Open up is UP

                    It doesn't matter how you chart an up market at open.
                    Up is UP.


                    Hi Fab,

                    Nope I didn't get the joke, and I come from
                    a family of jokers.<g>

                    I think that chart may show some useful forward analysis
                    given it were a third-party program Rt and one had
                    knowledge on the movement of planets.

                    Best,

                    ~j

                    Comment


                    • #70
                      JJ

                      Summa Ius , Summa Iniuris!

                      I bet you didn't get the Joke

                      Encore une fois, ca fait pas du mal de tout...!

                      Salut le copain!
                      Last edited by fabrizio; 07-31-2003, 07:20 AM.
                      Fabrizio L. Jorio Fili

                      Comment


                      • #71
                        The Dow forked-up

                        Yes, the market is in a historic bull run believe or not.,
                        This is an impressive chart!

                        Comment


                        • #72
                          Another follow-up chart

                          We talked about buy the dip strategy the market
                          has been in for months. Many charts are moving
                          with the trend. I would expect overlooked small caps
                          to continue to outperform. JMO
                          ~j

                          Comment


                          • #73
                            Sideways is good

                            Sideways is good when you can get it.
                            When the market doesn't give back gains quickly
                            that's good. I would prefer a more reasoned market
                            but valuations are what fools are willing to pay.<g>

                            Expecting some retracement from new lofts...
                            ~J

                            Comment


                            • #74
                              rook at da Candlesticks

                              Lots of japanese candlestick pattern watchers were watching
                              closely today.....let's see what develops from here.

                              So much for sideways<g>

                              Last edited by JJordan; 07-31-2003, 01:13 PM.

                              Comment


                              • #75
                                Stochastics a traders friend

                                Some nice signals

                                Comment

                                Working...
                                X