Announcement

Collapse
No announcement yet.

Advanced Charting Methods & Ideas

Collapse
X
 
  • Filter
  • Time
  • Show
Clear All
new posts

  • Index watching

    The NAS is in a difficult spot. I am watching
    the 9ma approach the 40ma on this daily
    chart and notice it's rather steep.

    It appears momentum can take us to a test of 1900
    ...look for signs of strength. Maybe intraday recovery?

    Comment


    • Retracements

      Gap near 50% fibonacci line, Price crosses 40 ma.
      A test of 62% retracement is now in progress.


      Tomorrow looks like a big day to me?

      ...be wise, watch the stochastic
      ~j

      Comment


      • Gaps, con't

        Look for strength if we fill the gap.
        Note any divergent stocks.


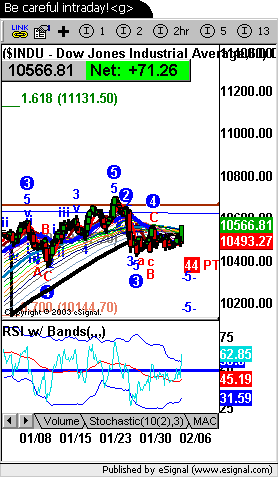
        INDU 60min
        Last edited by JJordan; 02-06-2004, 08:32 AM.

        Comment


        • Gaps, con't

          Be flexible intraday, maybe more, maybe not!


          Eitherway should be fun into the close!<g>

          ~j

          Comment


          • T-Mobile Pocket PC--- Toppy Charts

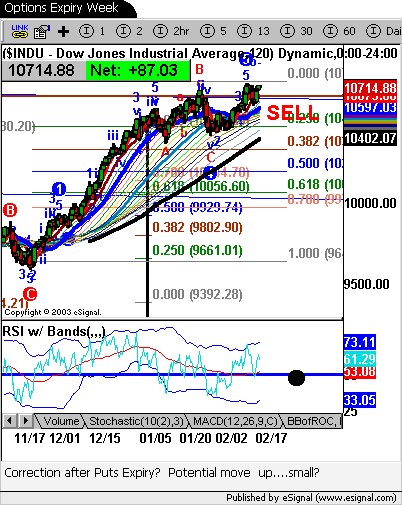
            It may get whippy during options flux

            .........I'm looking for the correction to begin soon?


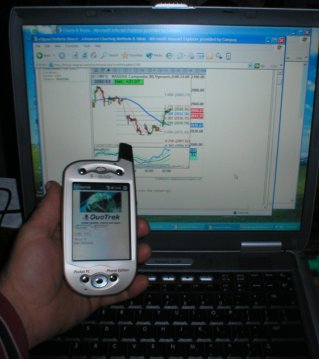
            Following the market remotely is difficult. Esignals
            new Quotrek resource makes it easier.

            Comment


            • JJ,

              I actually have tomorrow the 19th as a potential CIT date time cycle wise. Also in particular the March 2nd - 3rd window for a significant change or acceleration. Here are my most recent thoughts OEX wise:


              I had been looking for a minor correction last Friday, which I thought had developed in the 60 minute and daily charts, but alas I got stopped out on yesterdays bullwinkle rampage.
              best,
              KingCAMBO
              "He who takes the tide, takes all..."

              Comment


              • Question on BB of ROC

                Hi Jordan,

                I have been following your posts and they are very impressive. I was trying to create the BB of ROC study using the Formula Wizard. However the study that I am getting is not like what you have on your chart (it shows the ROC line with another line which I am assuming is the middle line of the BB). Would it be possible for you to post the efs here? Thanks a lot in advance.

                Sesh

                Comment


                • Found It!!

                  Hi Jordan,

                  I found the efs on this thread. Thanks.

                  Sesh

                  Comment


                  • Originally posted by
                    KingCAMBO

                    "A wise man rules his stars, a fool obeys them."


                    Hi Cambo,

                    Thanks for your thoughts.

                    If your still using the 3PB/3LB charts in your trading,
                    I will look forward to seeing a few OEX charts posted for other guests.

                    The Dow was down and the S&P held......interesting(almost normal some days).
                    We should begin seeing very nice swings and added volatility.
                    I also like watching the SP100 closely.

                    Best,

                    ~j

                    Be Trader smart.....don't forget your mistakes!

                    Everyone complains of his memory, and nobody complains of his judgment.
                    Last edited by JJordan; 02-18-2004, 07:47 PM.

                    Comment


                    • Hi JJ,

                      This is my first attempt at chart posting so bear with me here...

                      OEX daily and some bullet points:


                      1. A 3PB short will not occur on the OEX until we close below the 564 area. 568 has been a square of 9 support & resistance magic number on OEX for awhile now.

                      2. OEX has been riding the main Gann 1 x 1 angle since mid December. If it were to make any serious breach of this angle we would not catch another support angle - the 1 x 2 - until the OEX 545 area

                      3. CCI - I don't know how to read this one yet. Checkmate I guess for now.

                      Yesterday was the sell short day in the 3 day OEX cycle. So I will be interested today to see if we can get a buy under violation at or through yesterday's lows.

                      best,
                      KingCAMBO's OEX
                      Last edited by KingCAMBO; 02-19-2004, 03:13 AM.
                      "He who takes the tide, takes all..."

                      Comment


                      • Consolidation

                        Thanks KC, Great work!

                        I'm happy to see the market consolidate it's gains and
                        develop a trading range. It's hard to create
                        a much better business climate. Jobs will be coming
                        by Spring and at a rate of 200k IMO, if they can
                        keep the GDP above 4% for an extended time.


                        Not much has changed since the beginning
                        of the year, it's becoming a stock pickers market.
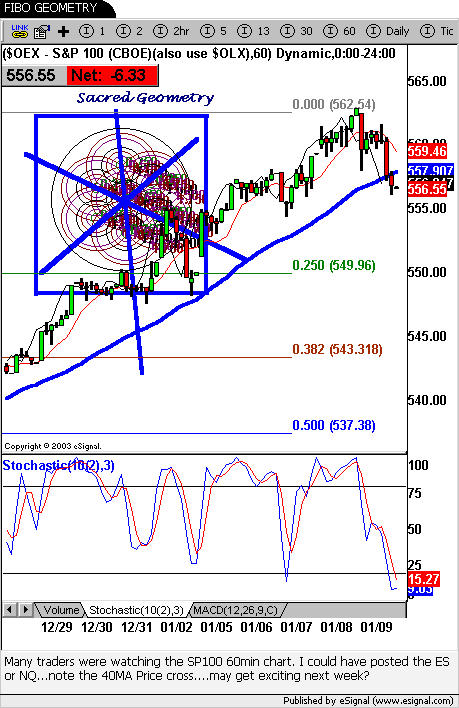
                        This chart from January is still valid. Since
                        everyone see's the same charts one might
                        expect the herds to move in unison until
                        big money begins shaking the trees. Options
                        and futures expiration just make it a convenient game
                        for the funds that trade.

                        ~j

                        We can forgive a child who is afraid of the dark; the real tragedy of life is when men are afraid of the light.

                        Comment


                        • Morning J!
                          I should probably add that if OEX continues to track that Gann 1 x 1 angle we are on a straight path to OEX 582.00 This is also a Square Of 9 target from the March 12th 2003 market structure low:


                          The real test for the BULLS right now will be the ability to crack 575.00 resistance.

                          Good Trading!
                          KingCAMBO
                          "He who takes the tide, takes all..."

                          Comment


                          • Special Thanks To Alex Montenegro for this formula study

                            Special thanks to Alexis C. Montenegro for making this
                            Price cross 3-3ma and 9ma .efs formula


                            Here is another like formula.....which was modified for this chart.

                            Comment


                            • TRADER TALK /What Are Charts Saying To You?

                              Some say chart reading is subjective, perhaps?

                              Cambo, please excuse the use of your chart....
                              this is how I begin looking at other peoples charts.


                              I generally stay with the trend until it breaks the 40ma.
                              (because that is the trend for me) My key intervals
                              are: 2min, 30min, 60min, 2hr

                              All other indicators simply lend support.

                              ~j
                              Last edited by JJordan; 02-21-2004, 06:08 PM.

                              Comment


                              • Rounding Tops con't.

                                ......Trends develop

                                Comment

                                Working...
                                X