Announcement

Collapse
No announcement yet.

Is This A Divergence?

Collapse
X
 
  • Filter
  • Time
  • Show
Clear All
new posts

  • Is This A Divergence?

    Hello All,

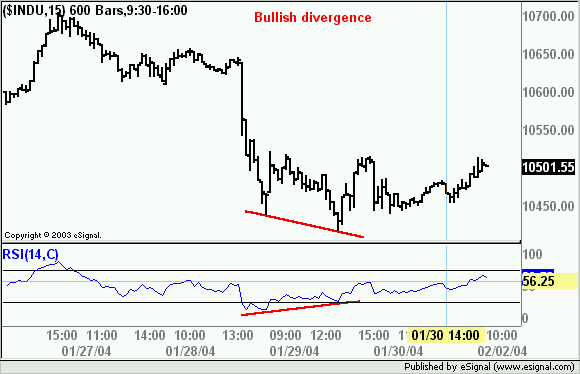
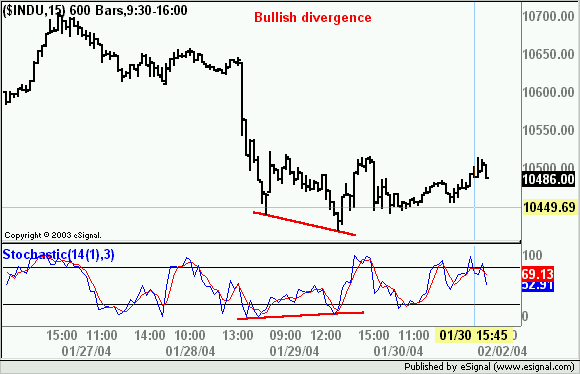
    Can someone take a look at the attached image and let me know if this is actually a divergence. I don't think it is.

    Cheers

    Carlton
    Attached Files

  • #2
    Carlton
    Yes it is. Higher prices are not reflected in higher indicator values.
    Alex

    Comment


    • #3
      Alex,

      I'm not entirely sure I understand what you mean. However, the following are quotes/definition on what is considered to be a diverence:

      Stochastic traces a bullish divergence, that is, when prices
      fall to a new low but the indicator makes a more shallow low.

      Divergences: When price is climbing and %D falling, or price is falling and %D climbing.


      As far as I can see none of the above are exhibited in the image.

      Carlton

      Comment


      • #4
        Carlton
        For starters you are referring to Stochastic and the image is for an RSI.
        Irrespective the divergence is there because the RSI does not make new highs while prices are doing that.
        Here are two examples of a bullish divergence using RSI and Stochastic. Prices post new lows but the corresponding RSI and Stochastic lows are not lower than the prior.
        Alex


        Comment


        • #5
          Alex,

          Thanks.

          There are few more questions I would like to ask about divergence.

          First, is there an efs that will highlight when a divergence occurs similar to the way you indicated in the chart you just posted? I know that the divergence2.efs shows when a divergence occurs, however it doesn't show the corresponding divergence on the price chart.

          Cheers

          Carlton

          Comment


          • #6
            OK,

            Now I understand bullish convergence. So why is this indicator giving me a bullish convergence signal when its clearly not?

            Cheers

            Carlton
            Attached Files

            Comment


            • #7
              Carlton:

              The divergence scripts, as I originally wrote them, look at the last two pivot points in the price and then compare the action (e.g., either up or down) to the action exhibited by the indicator at the same point in time. It works to a degree. The best way to do it would be to gather pivot points for the indicator as well as for the price series and then do a comparison to the actual nearest pivots that occur in both the price series and the indicator series. Quite a bit of coding involved and I did not have the time or the patience to do so when I wrote the indicators. I believe that there are at least one or two very nice divergence indicators out there now written by other eSignal users. Do a search in File Share and on the BB and you will probably find some that are better suited to the task.

              Chris

              Comment


              • #8
                Chris,

                I was informed by a guy called Lancer that you might be able assist me in getting a 3/10 Oscillator to identify divergences with a line. He put together the attached formulae. May be you could tweak it so that it shows the divergences.

                Cheers

                Carlton
                Attached Files

                Comment

                Working...
                X