Announcement

Collapse
No announcement yet.

Which way will we go?

Collapse
X
 
  • Filter
  • Time
  • Show
Clear All
new posts

  • Which way will we go?

    Fabrizio --

    I saw your post about the next direction for ES... (and, thought I'd start a new thread...)

    So, playing w/ AGET, I calculated THIS as the next direction.

    Why (per AGET):
    - Impulse/Correction pattern
    - Good PTI
    - Meeting ellipse levels
    - Proper OSC setup

    Why (non-AGET):
    - INTC showing complete Wave 4 on weekly / ready to trend up
    - Many large caps in indexes showing wave-4 completions
    - TRINQ
    - Sentiment: People looking for correction.
    - Lows: We keep tripping STOP LOSS orders (break lows) but don't have a sell off -- i.e. we are all sold out.

    Why would we go down:
    - ? Couldn't find a real reason...

    Is Tom Joseph around? I'd like him to slap me around a bit and tell me if I'm improperly applying AGET?

    Thanks all,

    -c
    Attached Files

  • #2
    Thought I'd try to post a bigger picutre. (It's hard sizing these things)
    Attached Files

    Comment


    • #3
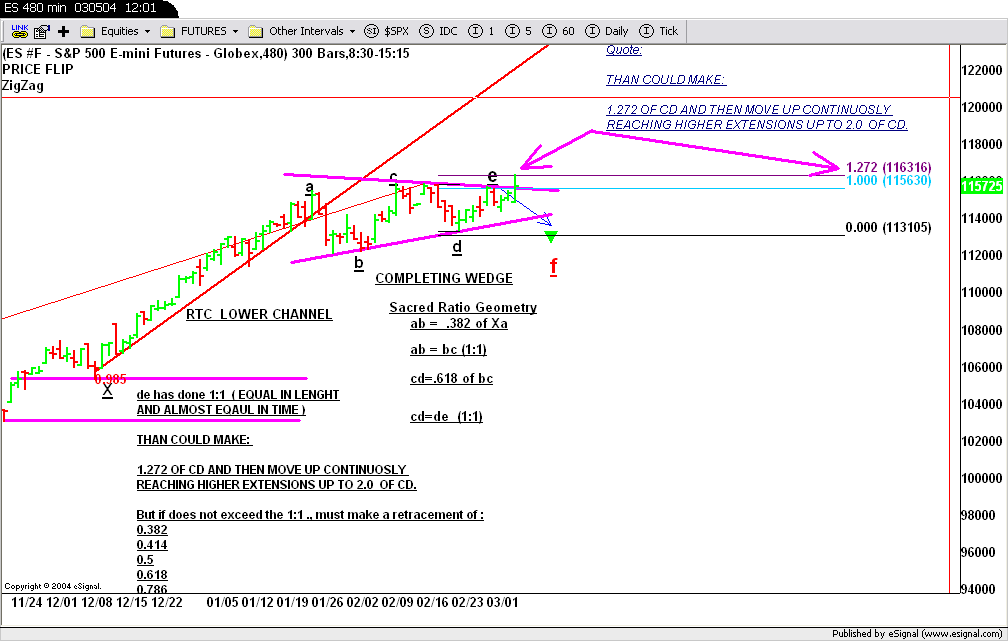
      THIS IS AN OPINION OF COURSE.

      HOWEVER I'LL POST YOU EVEN A DIFFERENT PERSPECTIVE.


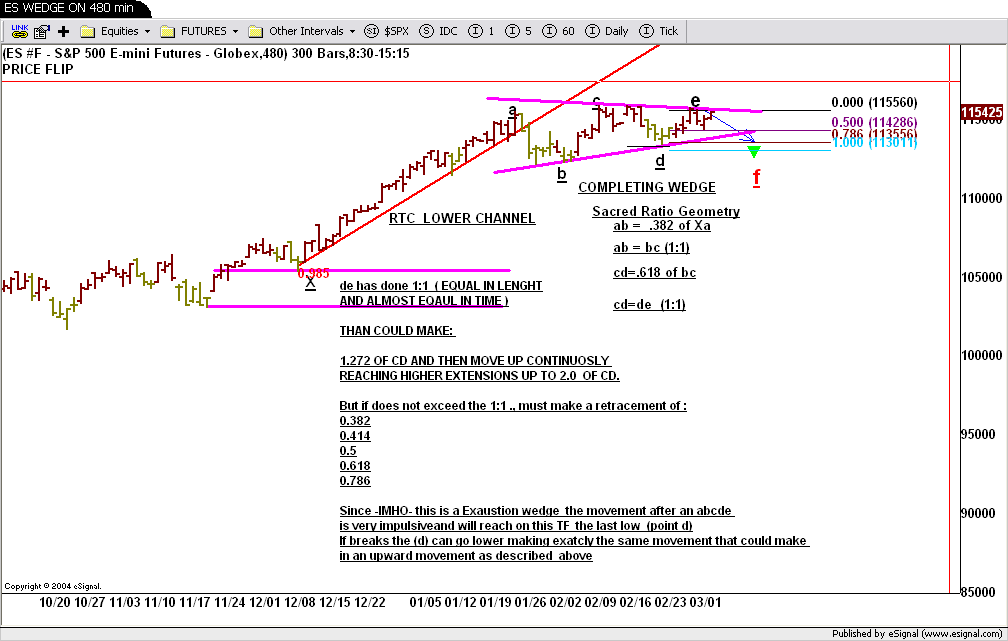
      RN ELLIOT WAVE PRINCIPLE:
      ALL WAVES OF SIMILAR DEGREE WILL RELATE BY GEOMETRIC RATIO IN BOTH TIME AND PRICE.

      HERE BELOW WE HAVE ENOUGH " good Geometric and Time ratios" to foresee the downward movement.

      This is always a possibility , never a certainity.
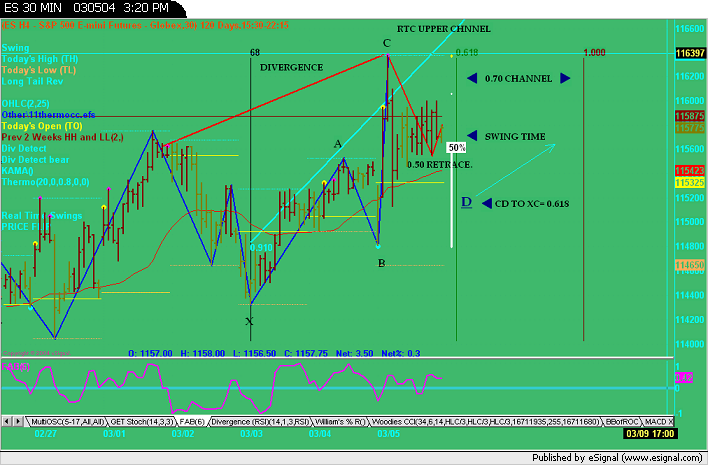
      now per exAMPLE HAS RETRACED O.50 of de and is going up.....so maybe i was wrong for 0.50 is a oefect "1st alternate
      X ABCD where di is up......


      Fabrizio L. Jorio Fili

      Comment


      • #4
        EW Contracting Triangle

        Seeing the same with my tool.

        Wave E of the Primary degree inverted Contracting Triangle with a rating of 118.4 is expected to complete in the price range 1147.8 to 1190.39, but more probably between 1151.31 and 1158.87. This wave is due to complete anytime from now until 12-Mar-2004, but is most likely to complete before 05-Mar-2004.

        When complete, expect the overall slope (ie. price range divided by time taken) of this wave E to be between 28% and 143% of the slope of wave C and between 19% to 183% of the slope of wave A. Wave E will complete this Contracting Triangle.
        Attached Files
        John Leabeater
        Editor/Publisher
        WallStreetBear.com
        [email protected]

        Comment


        • #5
          leabeater

          My deep compliment for the perfect charting and detailed explanation.

          Impressed.

          This is the pleasure that i prove when I see t analisys like this and done with serene withe competence and outlined thinking in probability .

          A real Thank you .
          Fabrizio L. Jorio Fili

          Comment


          • #6
            I beleive that the jobs report tommorow will decide the last move of this channel. I have been preparing for this day for weeks.

            Fibbgann
            Excellent book on JavaScript for beginners

            Comment


            • #7
              Amazing.

              Four 'traders' analyzing the market and we have different view points. This, I guess, is why these things work / fail sometimes.

              Fabrizio / leabeater: I have to admit your angles/retracements is at a level far, far beyond where I am... Me, I just see a wedge or cup/handle formation. And, I like the general 5/35 oscillator because it 'aligns' w/ so many other indicators. (stochastics, macd, etc) so, it self-fulfills <x% of the time>.

              Anyhow, at first I read your posts, started doubting myself and was about to close out my positions on Globex (1/2 of them, anyway) but I still think we're going up!

              Actually, I trade NQ/QQQ (I like the options -- better spreads / more volatility), so I'm attaching my QQQ chart / how I see it?

              Since indexes move together (more or less) if the S&P goes down, QQQ will likely follow.

              I'd love your feedback.

              FibbGann: I agree w/ your point of view on the JOBS report moving the market but DANGED if I've ever been able to guess which way it will move! Heck, I could know the # and STILL not make money on it because it just always seems that someone has an excuse as to why it went the other way... The most glaring event, for me, was when INTC reported last month and said, "We've had the highest revenue -- ever", beat estimates and the stock went down -- for 8 straight weeks. Go figure...

              Now -- I say all this and I see INTC just dropped the ball on their mid-quarter update. Down 1/2% afterhours. But, it didn't come even close to breaking support, so... Maybe we will rally since the priced-in #'s are now confirmed? Who knows!


              Fabrizio/leabeater, I'd love your take on my wave calcs? Where I'm looking @ things wrong?

              Thanks all -- nice talking with a group of fellow traders.
              Attached Files

              Comment


              • #8
                I deleted my last post, because I was informed that it may have been offensive to others. That was not my intention!!! I was just sharing my own experiences.

                Sorry if I offended anyone!

                Fibbgann
                Excellent book on JavaScript for beginners

                Comment


                • #9
                  OK, so I got to paranoia some more and...

                  Here's another possible view of this... Is there any reason this couldn't be the 1-2 as labeled here w/ a projection to the MOB (wave 4 from March wave)?

                  I guess tomorrow will show if we break our of the fork!

                  This would be more in-line w/ your thoughts Frabrizio / leabeater?
                  Attached Files

                  Comment


                  • #10
                    QQQ Analysis: Futures Flat &amp; Jobs - Schmobs

                    So long as 37.18 is not taken out on the upside the longer term sentiment will rule the roost.

                    The jobs numbers can go either way:

                    1. Adding jobs cuts profits = pull your money out.

                    2. Adding jobs increases retail sales = put your money in.

                    Then there is that pesky PPI number that just doesn't want to make an appearance.

                    So, do we trade on news or do we stick with the overall patterns we see?

                    U.S. FUTURES & MARKETS INDICATORS
                    Mar 2004 Change Price Last updated
                    S&P 500† +0.30 1154.50 3/5 5:54
                    Fair Value 1154.56 3/4 18:56
                    Difference * -0.06 3/4 18:56

                    Mar 2004 Change Price Last updated
                    NASDAQ† 0.00 1477.50 3/5 5:56
                    Fair Value 1481.84 3/4 18:56
                    Difference * -4.34 3/4 18:56

                    Mar 2004 Change Price Last updated
                    DOW JONES† +1.00 10582.00 3/5 5:47
                    DJIA contracts

                    The minute charts allow much more room to the upside. But I prefer to stay with the dominant pattern on the daily charts when the minute point in both directions.

                    Wave 2 of the Minor degree inverted Impulse with a rating of 99 is expected to complete in the price range 36.287 to 37.18 [the top of wave 1], but more probably between 36.491 and 36.85. This wave was expected to complete before 04-Mar-2004, and must complete by 10-Mar-2004.

                    After this wave 2 is complete, expect the market to continue down into wave 3. Wave 3 should always be an Impulse and should retrace wave 2 completely. Expect wave 3 to retrace wave 2 by 222% - 403%. Wave 3 can also be expected to be 106% - 403% of the price length of wave 1. The expected time for wave 3 to complete is 35% - 364% of the time taken for wave 2 to complete and 41% - 204% of the time taken for wave 1 to complete. The slope (ie. price range divided by time taken) of wave 3 should be between 39% and 177% of the slope of wave 1. Once wave 3 is complete, expect wave 4 to be a sideways corrective movement, then wave 5 to continue in the same direction as wave 3. Wave 5 will complete this Impulse.

                    Wave (C) of the Intermediate degree Zigzag with a rating of 94.3 is expected to complete in the price range 31.315 to 36.129, but more probably between 34.434 and 35.905. This wave is due to complete anytime from now until 29-Mar-2004, but is most likely to complete before 10-Mar-2004.

                    This wave (C) will complete the ZigZag pattern.

                    This is the final wave in the pattern. When complete it will also complete wave Y of the Primary degree Double Zigzag with a rating of 93.6. These two waves have the same target ranges.

                    Wave Y will probably complete this Double Sharp pattern, although it could possibly extend into a Triple Sharp pattern.
                    Attached Files
                    Last edited by leabeater; 03-05-2004, 03:44 AM.
                    John Leabeater
                    Editor/Publisher
                    WallStreetBear.com
                    [email protected]

                    Comment


                    • #11
                      EWA3 QQQ Minute Chart: Limited Upside Potential

                      Limited upside potential if this morphs into a Flat correction off the Feb. 23 lows. I do not see a larger impulse pattern brewing particularly in light of the longer term QQQ off the March 2003 lows.

                      Wave C of the Minor degree inverted Flat with a rating of 105.1 is expected to complete in the price range 36.4638 to 38.2175, but more probably between 36.9876 and 37.7485. This wave is due to complete anytime from now but is most likely to complete before 12-Mar-2004.

                      This wave C will complete the Flat pattern.

                      This is the final wave in the pattern. When complete it will also complete wave (B) of the Intermediate degree Zigzag with a rating of 85.3. These two waves have the same target ranges.

                      After wave (B) is complete, expect the market to continue down into wave (C), which should be a five wave impulsive pattern. Expect wave (C) to retrace wave (B) by 127% - 277%. Wave (C) can also be expected to be 43% - 277% of the price length of wave (A). The expected time for wave (C) to complete is 20% - 191% of the time taken for wave (B) to complete and 55% - 221% of the time taken for wave (A) to complete.

                      Wave Y of the Primary degree Double Zigzag with a rating of 91.1 is expected to complete in the price range 31.7372 to 35.8642, but more probably between 34.6527 and 35.8291. This wave is due to complete anytime from now but is most likely to complete before 15-Mar-2004.

                      Wave Y will probably complete this Double Sharp pattern, although it could possibly extend into a Triple Sharp pattern.
                      Attached Files
                      John Leabeater
                      Editor/Publisher
                      WallStreetBear.com
                      [email protected]

                      Comment


                      • #12
                        I add my point which is 100% in line with leabeater.
                        Of Leabeter I can just say that - again- I am impressed .
                        I wish this forum would be populated by many like you. The thoroghfull knowledge of RN Elliot (but from the point of view of a trader not am analyst) and your approach (manual count like mine but more complete, detailed and scientific respect to mine) makes each post of yours a pleasure.

                        -
                        So, do we trade on news or do we stick with the overall patterns we see?
                        This is My approach . I couldn't care less of new. Markets follows rules that DO not contempalte news.
                        I trade what I see, not what I beleive, and I trade the market not the impulse that a news can give. If the matrket is liquid it will be "reabsorbed" shortly , and get back to the natural direction.

                        I'm just back from a trip out of Italy and you all will excuse me for the poor analisys I post.
                        Just want to point out taht despite the news the upward move was JUST contained inside the foresee 1,272 once the 1:1 would have been exceeded

                        I keep sticking my target where is it.


                        Fabrizio L. Jorio Fili

                        Comment


                        • #13
                          Last bar on 30 min is downward "Price Flip "


                          Fabrizio L. Jorio Fili

                          Comment


                          • #14
                            Fabrizio / leabeater: You're charts are way beyond me... Fabrizio: did you say you now think direction is UP?

                            Linus: You and I have a similar view! Today, the market printed the ONLY bar it could have printed that would prevent a direction decision from occuring. Amazing how that works. But, the fact that we held and squeezed all the shorts makes me think UP!

                            Anyhow, we could print 5 Narrow Ranges in a row but I'm hoping one of these forks gets broken so I have a better indication.

                            TRINQ is 'iffy' on direction but the overall AdvanceDecline line / volume is saying we are under accumulation...

                            I was a bit squeamish on the gap down and had a nice score @ the top of that around 10:30am...

                            I'm still long.

                            -c
                            Attached Files

                            Comment


                            • #15
                              For what it's worth:
                              Here's the forks on a 60-min. We are in the 'north' fork.

                              This may give an earlier indication of a down direction if we break to support. But, we are still below our 50-day MA on NQ. SPX is still well in strong bull territory...

                              NQ could rally furiously -- if it can break its 200-period average on the 60-min chart. The 50/200 should collide in the next day or so...

                              Golden cross (or, rejection...).
                              Attached Files

                              Comment

                              Working...
                              X