Would like to develope while using one date range and back test using different date range. How is this accomplished? Have tried using Time Templates but can't seem to get them to do anything beyond time of "day".
Announcement
Collapse
No announcement yet.
In Sample / Out Sample
Collapse
X
-
Greymire,
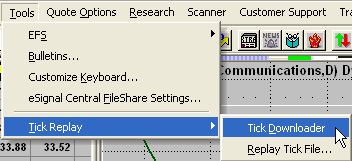
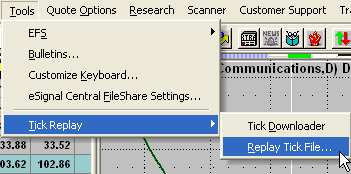
The Time Templates are basically a way to control the start end time displayed in the Advanced Chart window. The back testing feature within eSignal is a two-step process. The process starts off with the Tick Downloader

By specifying how much data you want to test with, as well as other parameters, you save the downloaded data as an .EPF file. By then replaying the previously saved tick file, you can back test the data as needed.

One important thing to keep in mind is that the back tested data will follow the Time Template that you have applied to your Advanced Chart window.
-
greymire
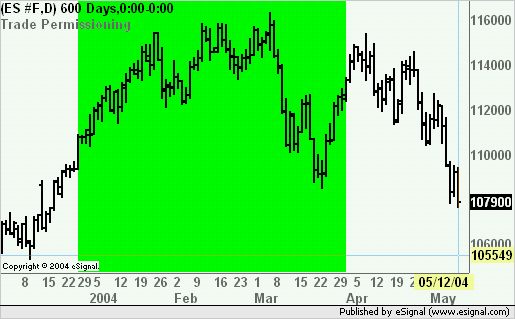
Here is a possible solution to set the Start and End of a trading period. The image reflects the conditions in the enclosed efs and would allow trades in the period where the background is colored in lime. You would then need to add a condition to close the trade at the end of the allowed period.
Alex

PHP Code:function preMain(){
setStudyTitle("Trade Permissioning");
setPriceStudy(true);
}
function main(Start,End){
var vTrade = 1;
var vYear,vMonth,vDay;
if(Start==null) Start=20031229;//date needs to be YYYYMMDD
if(End==null) End=20040331
vYear=getYear()+"";
vMonth=getMonth()+"";//turns the number into a string
if(vMonth<10)//if the value in the string is less than 10
vMonth = 0+vMonth;//add a 0 in front
vDay = getDay()+"";//same logic for vDay
if(vDay<10)
vDay = 0+vDay;
if((vYear+vMonth+vDay)<Start || (vYear+vMonth+vDay)>End){
vTrade=0;
}
if(vTrade==1){
setBarBgColor(Color.lime);
//insert your trading strategy under the condition that vTrade=1;
}
return;
}
Comment

Comment