Hi Alexis,
Once again can't thank you enough for all your patience and assistance. Thanks to you Jason, Steve, Chris, and others on this forum I am making real progress on developing viable systems that I will post when the results are confirmed.
I ran across this in one of your earlier postsand had one question.
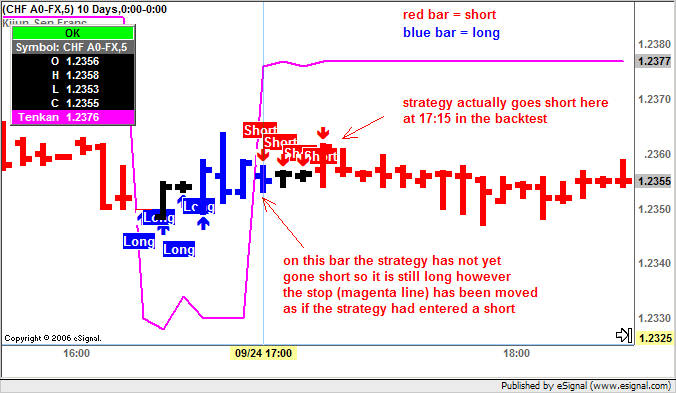
When I run it on intraday data, I'm getting multiple short and long positions generated and based on the test being done on line 2 and 12 cannot see why the code block is being executed:
I'm tring to follow the guidelines for no posting too much code and thought you were familiar with the code. If you need the entire efs let me know.....
Also had one question regarding the bar range for FOREX symbols
GBP A0-FX, EUR A0-FX etc. using a candlestick chart they appear to all have unusually long wicks indicating highs and lows that look beyond the actual range where the bids were occuring.
Can you shed any light on what I'm seeing?
My concern is that many of the strategies that will look at highs and lows for stops and profit targets will be getting filled in a strategy report beyond where the market was actually trading during a backtest?
Am I correct in my assessment and therefore code for that condition using perhaps using open and close as the more realistic range where trading activity place or adjusting the slippage accordingly?
thanks again
glen
Once again can't thank you enough for all your patience and assistance. Thanks to you Jason, Steve, Chris, and others on this forum I am making real progress on developing viable systems that I will post when the results are confirmed.
I ran across this in one of your earlier postsand had one question.
When I run it on intraday data, I'm getting multiple short and long positions generated and based on the test being done on line 2 and 12 cannot see why the code block is being executed:
PHP Code:
 if(getBarState()==BARSTATE_NEWBAR){

        if(Strategy.isLong() == false){

        if(vMA1.getValue(MAStudy.MA,-1)>vDonchian_2.getValue(DonchianStudy.BASIS,-1)){

               Strategy.doLong("Long",Strategy.LIMIT,Strategy.THISBAR,null,close(-1)-.0005);

               vEntryPrice = open(0);

               vStopPrice = vEntryPrice-(Stop*MinTick); }


        }

        if(Strategy.isShort() == false){

        if(vMA1.getValue(MAStudy.MA,-1)<vDonchian_2.getValue(DonchianStudy.BASIS,-1)){

               Strategy.doShort("Short",Strategy.LIMIT,Strategy.THISBAR,null,close(-1)+.0005);

               vEntryPrice = open(0);

               vStopPrice = vEntryPrice+(Stop*MinTick);}


        }

    }
Also had one question regarding the bar range for FOREX symbols
GBP A0-FX, EUR A0-FX etc. using a candlestick chart they appear to all have unusually long wicks indicating highs and lows that look beyond the actual range where the bids were occuring.
Can you shed any light on what I'm seeing?
My concern is that many of the strategies that will look at highs and lows for stops and profit targets will be getting filled in a strategy report beyond where the market was actually trading during a backtest?
Am I correct in my assessment and therefore code for that condition using perhaps using open and close as the more realistic range where trading activity place or adjusting the slippage accordingly?
thanks again
glen

Comment