Announcement

Collapse
No announcement yet.

Question on ICHIMOKO efs

Collapse
X
 
  • Filter
  • Time
  • Show
Clear All
new posts

  • Question on ICHIMOKO efs

    Hi Alexis,

    Once again can't thank you enough for all your patience and assistance. Thanks to you Jason, Steve, Chris, and others on this forum I am making real progress on developing viable systems that I will post when the results are confirmed.

    I ran across this in one of your earlier postsand had one question.

    When I run it on intraday data, I'm getting multiple short and long positions generated and based on the test being done on line 2 and 12 cannot see why the code block is being executed:

    PHP Code:

     
    if(getBarState()==BARSTATE_NEWBAR){ 
            if(
    Strategy.isLong() == false){
            if(
    vMA1.getValue(MAStudy.MA,-1)>vDonchian_2.getValue(DonchianStudy.BASIS,-1)){
                   
    Strategy.doLong("Long",Strategy.LIMIT,Strategy.THISBAR,null,close(-1)-.0005);
                   
    vEntryPrice open(0);
                   
    vStopPrice vEntryPrice-(Stop*MinTick); }
                 
            }
            if(
    Strategy.isShort() == false){
            if(
    vMA1.getValue(MAStudy.MA,-1)<vDonchian_2.getValue(DonchianStudy.BASIS,-1)){
                   
    Strategy.doShort("Short",Strategy.LIMIT,Strategy.THISBAR,null,close(-1)+.0005);
                   
    vEntryPrice open(0);
                   
    vStopPrice vEntryPrice+(Stop*MinTick);}
                 
            }
        } 
    I'm tring to follow the guidelines for no posting too much code and thought you were familiar with the code. If you need the entire efs let me know.....

    Also had one question regarding the bar range for FOREX symbols
    GBP A0-FX, EUR A0-FX etc. using a candlestick chart they appear to all have unusually long wicks indicating highs and lows that look beyond the actual range where the bids were occuring.

    Can you shed any light on what I'm seeing?

    My concern is that many of the strategies that will look at highs and lows for stops and profit targets will be getting filled in a strategy report beyond where the market was actually trading during a backtest?

    Am I correct in my assessment and therefore code for that condition using perhaps using open and close as the more realistic range where trading activity place or adjusting the slippage accordingly?


    thanks again

    glen
    Last edited by demarcog; 09-22-2006, 12:20 PM.
    Glen Demarco
    [email protected]

  • #2
    demarcog
    I ran a back test using the original script from which the section of code you posted was taken and as far as I can see it is not triggering multiple trades in the same direction.
    How are you determining that multiple trades are being executed?
    Alex

    Comment


    • #3
      Originally posted by Alexis C. Montenegro
      demarcog
      I ran a back test using the original script from which the section of code you posted was taken and as far as I can see it is not triggering multiple trades in the same direction.
      How are you determining that multiple trades are being executed?
      Alex
      When I loaded the study into a 5 minute 1 day chart of CHF A0-FX
      for Friday I saw 2 consecutive "Short" graphics corresponding to bars 12:45, and 12:50, and three "Longs" at 14:00, 14:05, and 14:10. I'll attach a screen shot ......and take a look at the strategy report.

      I've seen some interesting techniques that I'd not seem before in a strategy: like using limit orders to buy 5 points below the prior bars low on a buy order for example and using the open(0) as the entry price.

      PHP Code:
       Strategy.doLong("Long",Strategy.LIMIT,Strategy.THISBAR,null,close(-1)-.0005);
                     
      vEntryPrice open(0);
                     
      vStopPrice vEntryPrice-(Stop*MinTick); 
      Do you foresee any possible problems with the accuracy of a back testing profitability using this entry/exit logic?
      Attached Files
      Glen Demarco
      [email protected]

      Comment


      • #4
        demarcog

        When I loaded the study into a 5 minute 1 day chart of CHF A0-FX
        for Friday I saw 2 consecutive "Short" graphics corresponding to bars 12:45, and 12:50, and three "Longs" at 14:00, 14:05, and 14:10.
        The reason why multiple graphic objects are being drawn on the chart is explained in this post of that same thread. If you run the actual back test you will see that only one trade is executed on each side
        Alex

        Comment


        • #5
          I'll read the post you mentioned, but there are some strange things happening with this strategy.

          I'm posting another snapshot of a single long trade that occurred at 16:45 today at 1.2349 and exit at 17:00 at 1.2376.

          The high of the 17:00 bar was 1.2358, why is the strategy reording the closing out of the long trade 18 points higher then actually occurred during the 17:00 time period?
          Attached Files
          Last edited by demarcog; 09-24-2006, 03:39 PM.
          Glen Demarco
          [email protected]

          Comment


          • #6
            demarcog
            What you are seeing is the result of two logic errors in the strategy.
            The first one is similar to the issue that draws multiple graphics and that I have already explained in the linked thread ie that certain commands are executed irrespective of the fact that the strategy has not entered a trade.
            - At 16:45 the strategy enters a long trade at 1.2349 which is the value of the prior Close ie 1.2354 minus 0.0005
            - At that point it will no longer evaluate the condition if(Strategy.isLong()==false) in lines 112-121 but because there is no provision to check if the strategy is in a trade it continues to evaluate the condition if(Strategy.isShort()==false).in lines 122-130.
            - At 17:00 vMA1 crosses under vDonchian2 hence all the commands contained in that block of code get executed. Note that these commands are executed even if the strategy does not actually enter a short
            - One of these commands sets the protective stop price (see line 128)
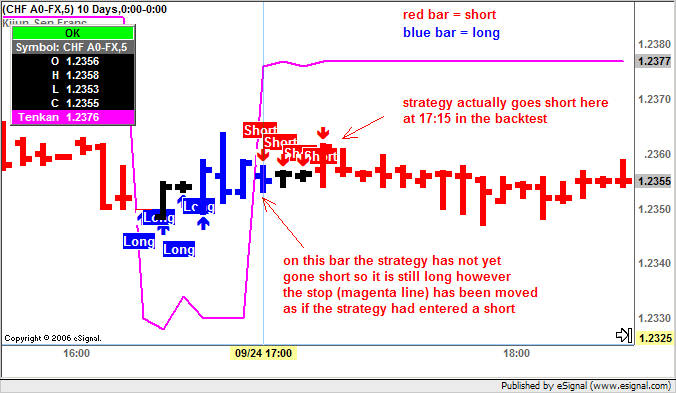
            vStopPrice = vEntryPrice +(Stop*MinTick) sets the stop at 1.2356 + (20 * 0.0001) equal to 1.2376. Note again that this happens regardless of the fact that the strategy has not entered a short trade hence it is still long.
            - On that same iteration of the efs the condition in lines 135-138 gets evaluated because the strategy is long. Because the stop has been moved to 1.2376 the Low of the current bar is now less than vStopPrice hence the command to Sell is executed.
            This is where the second error in the strategy occurrs due to the fact that there is no provision to check if the stop price has actually been breached by the bar that generates the trade.
            - Because in the doSell() command the FillType is Strategy.STOP the price that will be used is the one set as the FillPrice ie vStopPrice regardless of the fact that the bar has not traded at that price hence the Sell is recorded in the back test at 1.2376
            In situations like this one where there may be an issue with a strategy you may find it useful to actually plot the stops and/or other values that are being used by a strategy as that will help identify the problems. Also useful is to color the bars when a strategy is long or short As an example see the following image which shows the behavior of the stop ie vStopPrice.and when the strategy actually is in a trade.


            At this point if you have further questions about this strategy you may want to address them to techinvest who is the author of the strategy.
            Alex

            Comment


            • #7
              Alexis,

              Thanks you very much for your help.

              I directed a response to techinvest, I knew he was modifying the origional and didn't realize he authored it, thought you did, which is the main reason I spent so much time on it, given the amazing work you do.

              Another crushing disappointment, a seemingly promising system added to the ranks of countless others....and I appreciate you illuminating the logic errors, now I understand why so much attention is paid in the backtesting doc on validating prices prior to executing limit and stop orders. I read in the doc that there was an issue with the strategy.Setstop recording trades outside a price bars range, should have realized it was true for limit and stop orders also.

              Most of us make the mistake of initially assume the strategy object would take care of that price range validation and I'm sure there were design issues that prevented that.

              If you would like and think it would be helpful (to you and Jason especially) I would be glad to post a suggestion that future backtesting engines validate price before recording a stop/limit trade price.

              Thanks Again,

              Glen
              Last edited by demarcog; 09-26-2006, 09:05 AM.
              Glen Demarco
              [email protected]

              Comment

              Working...
              X