 Tweet
Tweet
Alexis,
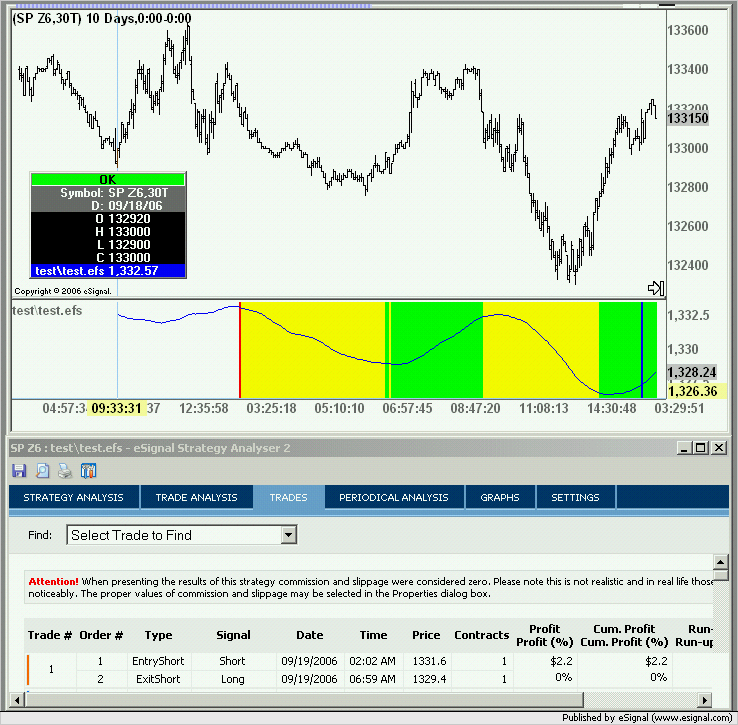
I have successfully used the script you sent me to start back testing on day 2, skipping day 1, for time (minute or greater) interval data. Worked great, yellow line at day 2 and all.
But, I can not seem to get the same script to work on tick interval data of any length 2 to 10 days. Have tried many combinations. Is there some other time designation required other than "get day" for tick data. What happens is the yellow line gets drawn at the beginning of day two, but the back testing still starts in day one, with the only partially initiallized studies., for day one, as before.
Will appreciate any help.
thx, Tilmon
Comment