Announcement

Collapse
No announcement yet.

initializing bt for tick data

Collapse
X
 
  • Filter
  • Time
  • Show
Clear All
new posts

  • initializing bt for tick data

    Alexis,
    I have successfully used the script you sent me to start back testing on day 2, skipping day 1, for time (minute or greater) interval data. Worked great, yellow line at day 2 and all.
    But, I can not seem to get the same script to work on tick interval data of any length 2 to 10 days. Have tried many combinations. Is there some other time designation required other than "get day" for tick data. What happens is the yellow line gets drawn at the beginning of day two, but the back testing still starts in day one, with the only partially initiallized studies., for day one, as before.
    Will appreciate any help.
    thx, Tilmon
  • #2
    Tilmon
    As far as I can see the example I provided is working also with tick based charts.
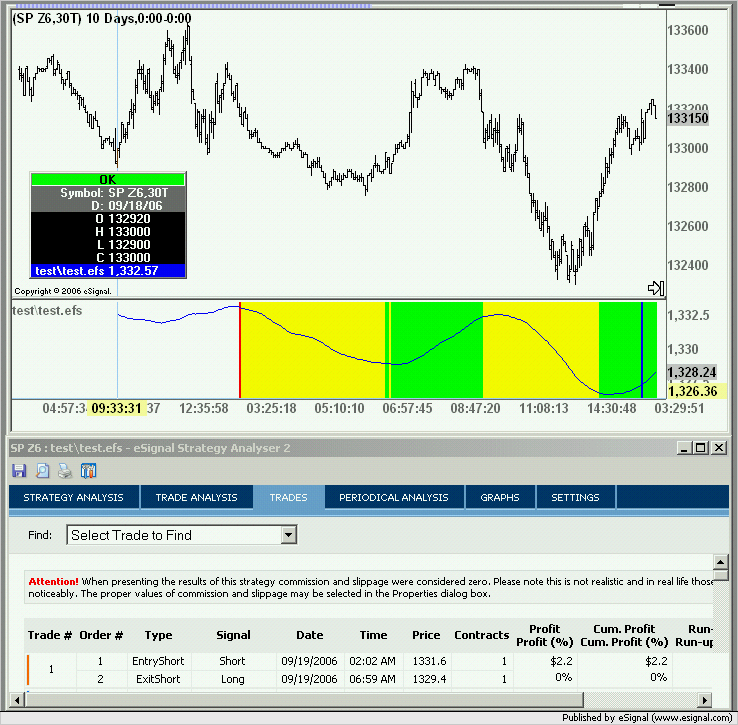
    In the following screenshot you can see that the strategy sample enclosed below is executing trades from the second day onwards. This is confirmed by the background color on the chart and by the back tester which shows the first trade on the 09/19/2006. Note that in the chart the cursor is placed on the first day so as to show the date which is 09/18/2006
    If this is not what you are seeing then you may want to post the code you are using so that I or someone else can go over it.
    Alex

    PS. When replying to a thread (or referring to one) please use the Post Reply button instead of New Thread or provide a link to the original thread as that makes it easier for all to follow the conversation


    PHP Code:
    var Counter 1;
    var 
    Avg null;

    function 
    main(){

        if(
    Avg==nullAvg sma(50);

        if(
    getDay(0) != getDay(-1) && getBarState() == BARSTATE_NEWBAR){
            
    Counter++;
        }

        if(
    Counter>=2){
            if(!
    Strategy.isLong()&&close(0)>Avg.getValue(-10))
                
    Strategy.doLong("Long",Strategy.CLOSE,Strategy.THISBAR);
            if(!
    Strategy.isShort()&&close(0)<Avg.getValue(-10))
                
    Strategy.doShort("Short",Strategy.CLOSE,Strategy.THISBAR);
        }

        if(
    Strategy.isLong()) setBarBgColor(Color.lime);
        if(
    Strategy.isShort()) setBarBgColor(Color.yellow);
        if(
    getDay(0) != getDay(-1)) setBarBgColor(Color.blue);
        if(
    Counter == && getDay(0) != getDay(-1)) setBarBgColor(Color.red);
        
        return 
    Avg.getValue(0);


    Originally posted by tilmon
    Alexis,
    I have successfully used the script you sent me to start back testing on day 2, skipping day 1, for time (minute or greater) interval data. Worked great, yellow line at day 2 and all.
    But, I can not seem to get the same script to work on tick interval data of any length 2 to 10 days. Have tried many combinations. Is there some other time designation required other than "get day" for tick data. What happens is the yellow line gets drawn at the beginning of day two, but the back testing still starts in day one, with the only partially initiallized studies., for day one, as before.
    Will appreciate any help.
    thx, Tilmon

    Comment


    • #3
      thx, it worked

      Alexis,
      It took me a few days to work it out, but your last reply regarding starting time intervals for tick interval data helped me locate a "looping" error in my script. The clue was in carefully studying the structure of the more detailed example which you included in last relply. I went on and created a user defined parameter box for starting day, and ran several good backtests based upon these revisions. Even though a few days late in my response, wanted to get back to you and close out this thread with the positive outcome report..
      thx,
      Tilmon

      Comment

      Working...
      X