Announcement

Collapse
No announcement yet.

Periodical analysis page

Collapse
X
 
  • Filter
  • Time
  • Show
Clear All
new posts

  • Periodical analysis page

    Hi, when i run an esignal backtest the trades listed under "Trades" seem in line with what should be happening. However, when i look at the "Periodical analysis" page i see totally different and unexplainable trades. So the different parts of the backtesting report are not in sync.

    What am i missing here, i suddenly have lot of concerns over past backtests and systems.
  • #2
    some files to illustrate

    the problem
    Attached Files

    Comment


    • #3
      Some files to

      illustrate the problem
      Attached Files

      Comment


      • #4
        Re: Periodical analysis page

        wolfyyy
        From what I am seeing at my end the Periodical Analysis appears to be working correctly.
        Here are the results with comments on a couple of simple tests that I ran to verify the behavior.
        The first test was to run the following efs which executes two trades each day (one Long and one Short). The trades are opened and closed on the same day
        PHP Code:
        function preMain(){
            
        setPriceStudy(true)
        }
        function 
        main(){
            if((
        hour(0)*100)+minute(0)==1115 && !Strategy.isLong())
                
        Strategy.doLong("Long at 11:15",Strategy.MARKET,Strategy.THISBAR)
            if((
        hour(0)*100)+minute(0)==1145 && Strategy.isLong())
                
        Strategy.doSell("Sell at 11:45",Strategy.MARKET,Strategy.THISBAR)      
            if((
        hour(0)*100)+minute(0)==1215 && !Strategy.isShort())
                
        Strategy.doShort("Short at 12:15",Strategy.MARKET,Strategy.THISBAR)        
            if((
        hour(0)*100)+minute(0)==1245 && Strategy.isShort())
                
        Strategy.doCover("Cover at 12:45",Strategy.MARKET,Strategy.THISBAR)    
            if(
        Strategy.isLong())
                
        setBarBgColor(Color.lime)    
            if(
        Strategy.isShort())
                
        setBarBgColor(Color.red)        
            if(
        day(0)!=day(-1))
                
        setBarBgColor(Color.yellow)

        The results shown in the Trades and Periodical Analysis pages of the StrategyAnalyser Report appear to match as you can see in the following two screenshots


        The second test [which probably reflects your situation] was to verify if it also works correctly when trades are carried over to the next day because these are marked to market in the Periodical Analysis (ie similarly to what your broker would do in an end of day statement).
        Here is the efs used for the test
        PHP Code:
        function preMain(){
            
        setPriceStudy(true)
        }
        function 
        main(){
            if((
        hour(0)*100)+minute(0)==1500 && !Strategy.isLong())
                
        Strategy.doLong("Long at 15:00",Strategy.MARKET,Strategy.THISBAR)
            if((
        hour(0)*100)+minute(0)==930 && Strategy.isLong())
                
        Strategy.doSell("Sell at 9:30",Strategy.MARKET,Strategy.THISBAR)
            if((
        hour(0)*100)+minute(0)==1215 && !Strategy.isShort())
                
        Strategy.doShort("Short at 12:15",Strategy.MARKET,Strategy.THISBAR)
            if((
        hour(0)*100)+minute(0)==1245 && Strategy.isShort())
                
        Strategy.doCover("Cover at 12:45",Strategy.MARKET,Strategy.THISBAR)
            if(
        Strategy.isLong())
                
        setBarBgColor(Color.lime)
            if(
        Strategy.isShort())
                
        setBarBgColor(Color.red)
            if(
        day(0)!=day(-1))
                
        setBarBgColor(Color.yellow)

        In this script the Long trade always carries overnight and is closed at the Open of the following day.
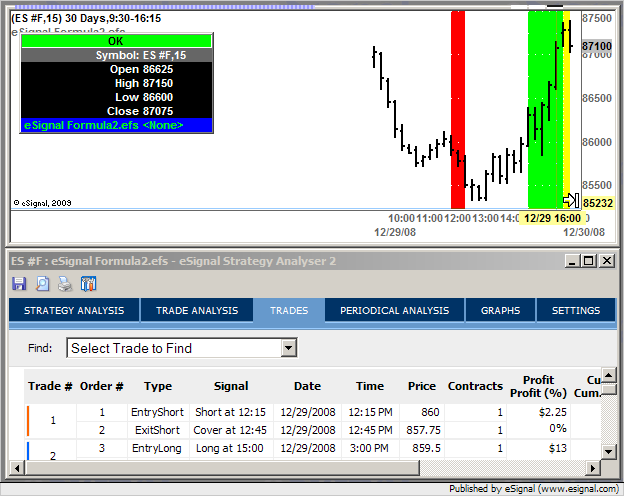
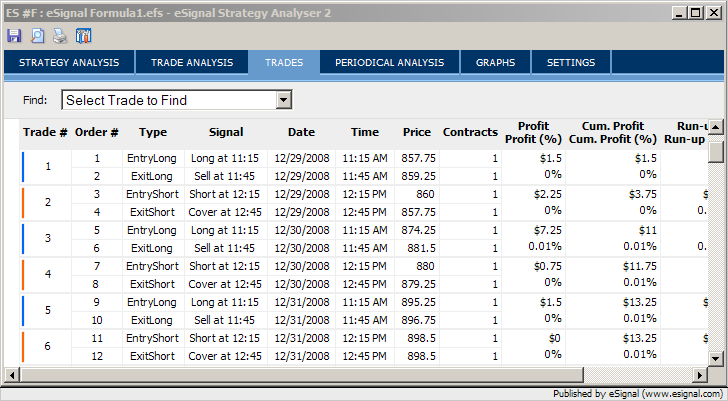
        Starting from the first traded day here are the Trades as shown in the Stratagy Analyser


        Keep in mind that the Long trade is closed only at the Open of the following day so the Periodical Analysis checks the last price on the day of the trade to determine that day's Profit/(Loss) in other words it marks to market the trade
        At this point the first thing that needs to be done is determine the last Close of the day which occurs at 16:15 [as per the Time Template used] and is 870.75 (see chart above where the Cursor is on the last bar of 12/29/08)
        So on 12/29/08 the strategy executed the following trades
        Short at 860.00
        Cover at 857.50
        for a net profit of 2.25
        Long at 859.50
        The closing price for 12/29/08 is 870.75 hence at the end of that day the Profit/(Loss) of the Long trade is
        970.75-859.50 = 11.25
        Add the Profit/(Loss) of these two trades and you have
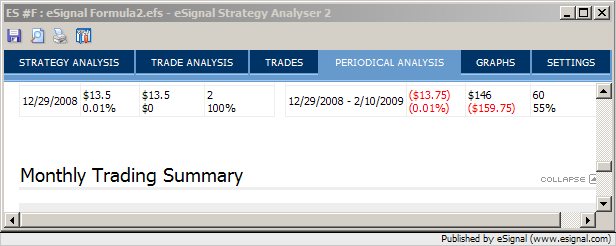
        2.25+11.25 = 13.50
        which is in fact what is shown in the Periodical Analysis for that day (see following image)


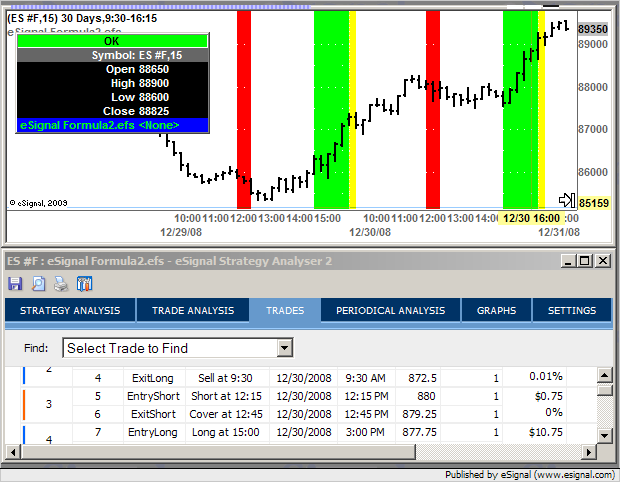
        At this point we move on to the following day where we close the Long trade at the Open of the first bar at 872.50
        This means that the Long trade has a carry-over Profit/(Loss) from the prior day's close ie
        872.50-870.75 = 1.75
        The strategy then executes a Short and closes it on the same day
        Short at 880.00
        Cover at 879.25
        for a net profit of 0.75
        The strategy then opens a Long trade that is carried over to the next day. So as in the previous example we need to determine the closing price on 12/30/08 which was 888.25 hence
        Long at 877.75
        closing price of 12/30/08 is 888.25
        for a net profit of 10.50
        In the following image the Cursor is again placed on the last bar of the day being discussed


        So at this point on 12/30/08 we have a carry over profit of the Long trade of 1.75, a profit from the Short trade of 0.75 and a profit from the [still open] Long trade of 10.50 therefore
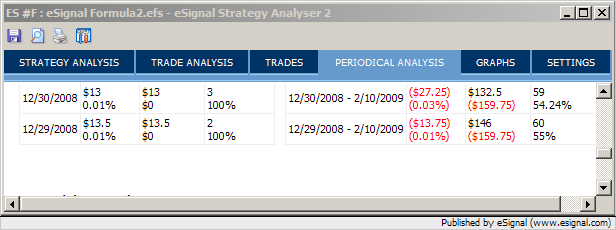
        1.75+0.75+10.50 = 13.00
        which again is what is being reported by the Periodical Analysis for 12/30/08 (see following screenshot)


        Again the Periodical Analysis appears to be working correctly at my end (note that I tested this over several days beyond what is discussed here)
        Apply the same logic to your strategy and if you come up with inconsistent results then you may need to post a sample script that illustrates the issue
        Alex


        Originally posted by wolfyyy
        Hi, when i run an esignal backtest the trades listed under "Trades" seem in line with what should be happening. However, when i look at the "Periodical analysis" page i see totally different and unexplainable trades. So the different parts of the backtesting report are not in sync.

        What am i missing here, i suddenly have lot of concerns over past backtests and systems.

        Comment


        • #5
          -

          wolfyyy
          BTW you can find the description of the methodology used for the Periodical Analysis in this article of the EFS KnowledgeBase
          Alex

          Comment

          Working...
          X