 Tweet
Tweet
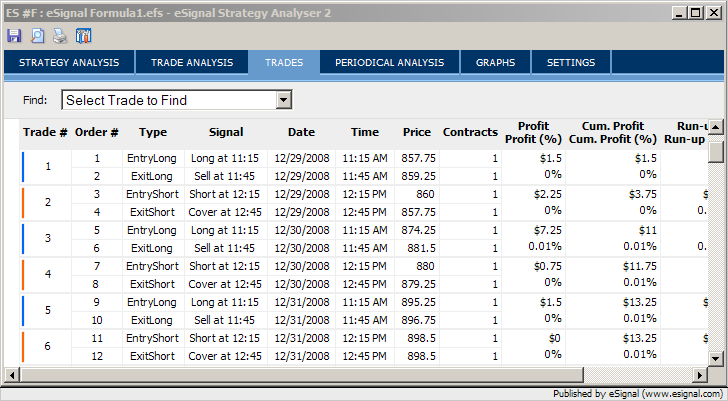
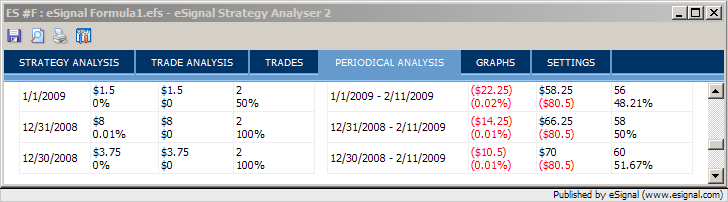
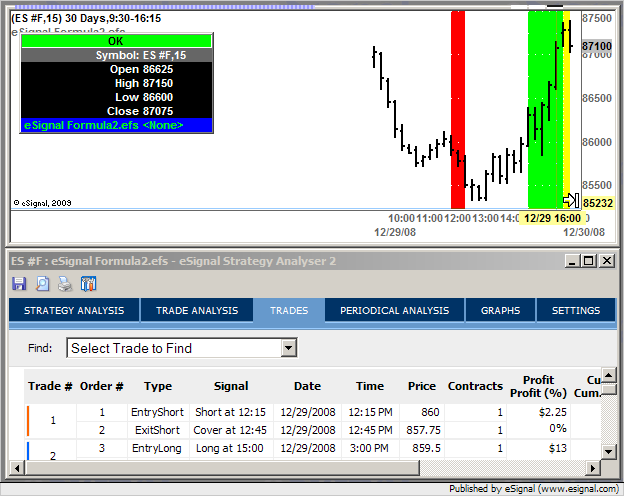
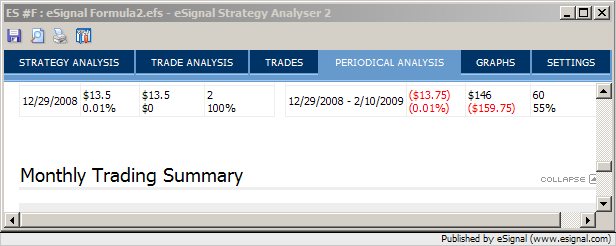
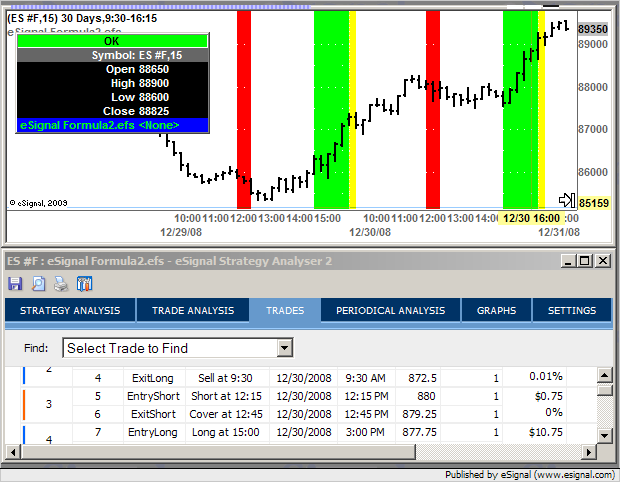
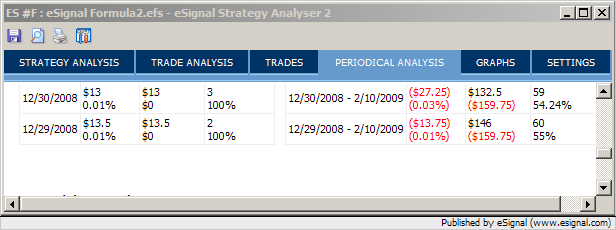
Hi, when i run an esignal backtest the trades listed under "Trades" seem in line with what should be happening. However, when i look at the "Periodical analysis" page i see totally different and unexplainable trades. So the different parts of the backtesting report are not in sync.
What am i missing here, i suddenly have lot of concerns over past backtests and systems.
What am i missing here, i suddenly have lot of concerns over past backtests and systems.
Comment