Announcement

Collapse
No announcement yet.

Another Dots Question

Collapse
X
 
  • Filter
  • Time
  • Show
Clear All
new posts

  • Another Dots Question

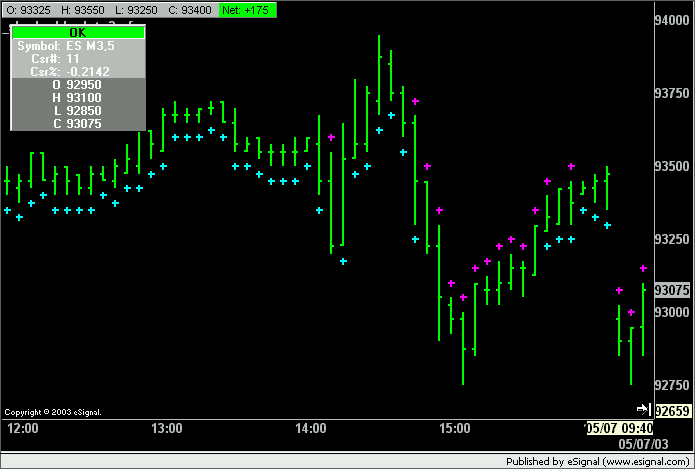
    Attached is a zipped document that contains two efs scripts and two charts.

    On the first script/chart, the dots are large. On the second script/chart, the dots are small.

    I want to have the first chart with small dots.

    Can someone please suggest a change in efs scripts to accomplish this.

    Thanks,

    DaTr8dr
    Attached Files

  • #2
    I dont think you can control the size of the dots with the efs.

    I beleive dot size is related to bar size. As the bars get bigger, so do the dots. The dots do not get smaller if the bars size is reduced.

    Comment


    • #3
      DaTr8dr

      As David said you cannot change the size of the Shapes.
      What you could do however is to use drawTextRelative instead of drawShapesRelative. As of now efs does not support Windings as a font - which would resolve all the shapes and symbols issue, but there is another font that has a dot and that is Symbol. Furthermore this font is installed on all Win based computers making the formula consistent on any machine.

      Try using the following in your RSI efs where you call drawShapes.

      drawTextRelative(0,high()+1.5,".",Color.red,null,T ext.CENTER|Text.BOTTOM|Text.ONTOP,"Symbol", 12)

      drawTextRelative(0,low()-1.5,".",Color.lime,null,Text.CENTER|Text.TOP|Text. ONTOP,"Symbol",12)

      Using the Editor replace the dot in "." by keying in the following
      Alt+0183 (type the numbers using the Numeric keypad while keeping Alt pressed)
      You may also have to adjust the font size to suit your needs (font size is the last number in the text properties, set at 12 in the lines above).
      An advantage to using this "dot" instead of a "period" of any other font is that this dot is vertically centered to the height of the font thereby separating the dot from the high/low of the bar even without a Y-offset.


      If instead you also like to have a square as a shape you can again use drawText to your advantage with a small trick
      Type in the following

      drawTextRelative(0,low()-1.5," ",null,Color.lime,Text.CENTER|Text.TOP|Text.ONTOP| Text.BOLD,"Arial",8)

      Notice that for the text there are just three spaces. Notice also that I don't color the text but I do color the background thereby creating a sort of square.
      You may have to tinker with the number of spaces and the font size to get the right size "shape".

      Hope this helps

      Alex
      Last edited by ACM; 05-11-2003, 08:56 AM.

      Comment


      • #4
        Thank you both for your reply. I will implement these suggestions today.

        My only other thought was can the first script be written similar to the second script where the line in the second describing the dot and size be used in the first script.

        I attempted to mirror the second script to the first script but was not very successful. Actually, I was not successful at all. LOL.

        Thanks again. This Bulletin Board has been a tremendous help to me.

        DaTr8dr

        Comment


        • #5
          Not directly because in the second one you are plotting the return of a study (the Parabolic SAR) that correlates to prices whereas in the first you are plotting a shape based on a condition of a study (the RSI) that doesn't.
          Having said that there may be a workaround that could be implemented.
          Use a Donchian Channel set to Length 1 and plot a return for the Upper and Lower channels only. Then set the plot type to dots like in the Parabolic study and default color black.
          Then in the onAction1() and onAction2() instead of drawing a Shape use setBarFGColor(Color.your color) to color the Upper and Lower Donchian channels. If the condition is met the plot of the Donchian should be colored correspondingly else it should (note the conditionals because I have not tried this) be black.
          Alex
          Last edited by ACM; 05-11-2003, 11:35 AM.

          Comment


          • #6
            Alex,

            Thank you, thank you.

            Your first suggestion worked like a champ.

            I will experiment with your second suggestion.

            You are a great help.

            DaTr8dr

            Comment


            • #7
              DaTr8dr
              You are welcome.
              With regards to the second solution (ie the Donchian channel) remember to add/subtract a few ticks to the Upper/Lower Donchian plots otherwise the dots will be right on the high/low of a bar.
              Alex
              Last edited by ACM; 05-11-2003, 11:37 AM.

              Comment


              • #8
                Alex,

                Here is my attempt to follow your suggestion on the donchain.

                I am definintely putting somthing in the wrong place, but the first suggestion works fine.

                Thanks for your help.

                DaTr8dr

                *****************

                var study = new DonchianStudy(9, 1);
                var vRSI21 = new RSIStudy(21, "Close");
                var vLastAlert = -1;
                function preMain() {
                setPriceStudy(true);
                setStudyTitle("_sb~~alex~donchian");
                setPlotType(PLOTTYPE_DOT, 0); // upper
                setPlotType(PLOTTYPE_DOT, 1); // lower
                }

                function main() {
                if (
                vRSI21.getValue(RSIStudy.RSI) < 51
                ) onAction1()

                ;if (
                vRSI21.getValue(RSIStudy.RSI) > 49
                ) onAction2();

                return null;
                function postMain() {

                }
                function onAction1() {
                setBarFgColor(Color.magenta);
                vLastAlert = 1;
                }

                function onAction2() {
                setBarFgColor(Color.magenta);
                vLastAlert = 2;}}

                Comment


                • #9
                  Alex,

                  I am attaching a word document with two screen shots. One has nice sloped dots (desirable), and one with non-sloped dots (acceptable.)

                  I think that what you were communicating to me in your prior post was that using the donchian as the basis to plot dots would result in sloped dots. If this is so, please let me know and I will continue to work on the script.

                  Thanks,

                  DaTr8dr
                  Attached Files

                  Comment


                  • #10
                    DaTr8dr
                    In the first Word doc you posted you asked for the dots to be the same size as those of the Parabolic study which is what the attached efs does (see image).
                    The Donchian channel is used in the efs only to plot the same type of dot not to produce a "sloped" plot.
                    Alex

                    Attached Files
                    Last edited by ACM; 05-11-2003, 09:38 PM.

                    Comment


                    • #11
                      thanks Alex.

                      DaTr8dr

                      Comment

                      Working...
                      X