Announcement

Collapse
No announcement yet.

MA cross over of an external symbol....Can someone tell me what I'm doing wrong here?

Collapse
X
 
  • Filter
  • Time
  • Show
Clear All
new posts

  • MA cross over of an external symbol....Can someone tell me what I'm doing wrong here?

    I'm also having a bit of trouble accessing an event from another symbol and if that event = true then DrawRelativeText/Shape/Icon on current chart when that event happens.

    For example:

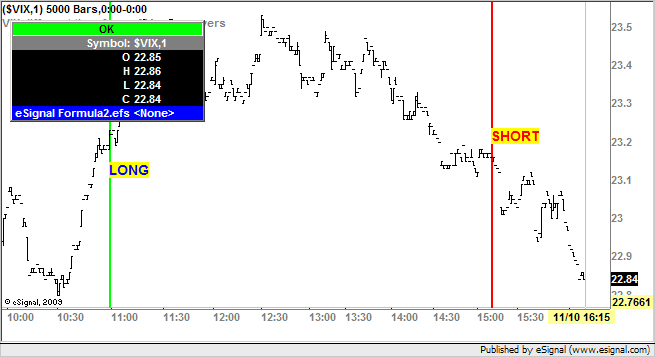
    I want the EFS to post a "B" on the chart of the ES #F, when the close() of symbol = "$VIX" crosses below it's 50MA on a 1 min chart.

    How do I write that in EFS? I cannot figure it out for the life of me and it's driving me crazy.

    Thanks in advance.

    Here is what I have currently:

    //{{EFSWizard_Description
    //
    // This formula was generated by the Alert Wizard
    //
    //}}EFSWizard_Description


    //{{EFSWizard_Declarations
    var vEMA8 = new MAStudy(8, 0, "Close", MAStudy.EXPONENTIAL);
    var vVWMA20 = new MAStudy(20, 0, "Close", MAStudy.VOLUMEWEIGHTED);
    var vSMA50 = new MAStudy(50, 0, "Close", MAStudy.SIMPLE);
    var vSMA200 = new MAStudy(200, 0, "Close", MAStudy.SIMPLE);
    var vLastAlert = -1;
    //}}EFSWizard_Declarations


    function preMain() {
    /**
    * This function is called only once, before any of the bars are loaded.
    * Place any study or EFS configuration commands here.
    */
    //{{EFSWizard_PreMain
    setPriceStudy(true);
    setStudyTitle("8MA-20MA X 50MA CrossEDITOR");
    setCursorLabelName("HIGH", 0);
    setCursorLabelName("LOW", 1);
    setDefaultBarStyle(PS_DASH, 0);
    setDefaultBarStyle(PS_DASH, 1);
    setDefaultBarFgColor(Color.black, 0);
    setDefaultBarFgColor(Color.black, 1);
    setDefaultBarThickness(3, 0);
    setDefaultBarThickness(3, 1);
    setPlotType(PLOTTYPE_LINE, 0);
    setPlotType(PLOTTYPE_LINE, 1);
    //}}EFSWizard_PreMain

    }

    function main() {
    /**
    * The main() function is called once per bar on all previous bars, once per
    * each incoming completed bar, and if you don't have 'setComputeOnClose(true)'
    * in your preMain(), it is also called on every tick.
    */

    //{{EFSWizard_Expressions
    //{{EFSWizard_Expression_1
    if (
    vSMA200.getValue(MAStudy.MA, -1) == null
    ) onAction1()
    //}}EFSWizard_Expression_1

    //{{EFSWizard_Expression_2
    else if (
    Strategy.isShort() == false &&
    vEMA8.getValue(MAStudy.MA, 1) > vSMA50.getValue(MAStudy.MA, 1) &&
    vVWMA20.getValue(MAStudy.MA, 1) >= vSMA50.getValue(MAStudy.MA, 1) &&
    close(1, 5, "VIX") > vSMA50.getValue(MAStudy.MA, 1) &&
    close() == vSMA200.getValue(MAStudy.MA, 1)
    ) onAction2()
    //}}EFSWizard_Expression_2

    //{{EFSWizard_Expression_3
    else if (
    vSMA200.getValue(MAStudy.MA, -1) == null
    ) onAction3()
    //}}EFSWizard_Expression_3

    //{{EFSWizard_Expression_4
    else if (
    Strategy.isLONG == false &&
    vEMA8.getValue(MAStudy.MA, -1) < vSMA50.getValue(MAStudy.MA, -1) &&
    vEMA8.getValue(MAStudy.MA) > vSMA50.getValue(MAStudy.MA) &&
    vVWMA20.getValue(MAStudy.MA, 1) < vSMA50.getValue(MAStudy.MA, 1) &&
    close(1, 5, "VIX") < vSMA50.getValue(MAStudy.MA, 1) &&
    close() < vSMA200.getValue(MAStudy.MA, 1)
    ) onAction4();
    //}}EFSWizard_Expression_4

    //}}EFSWizard_Expressions


    //{{EFSWizard_Return
    return new Array(
    high(),
    low()
    );
    //}}EFSWizard_Return

    }

    function postMain() {
    /**
    * The postMain() function is called only once, when the EFS is no longer used for
    * the current symbol (ie, symbol change, chart closing, or application shutdown).
    */
    }

    //{{EFSWizard_Actions
    //{{EFSWizard_Action_1
    function onAction1() {
    vLastAlert = 1;
    }
    //}}EFSWizard_Action_1

    //{{EFSWizard_Action_2
    function onAction2() {
    if (vLastAlert != 2) drawShapeRelative(0, high(), Shape.DOWNARROW, "", Color.RGB(255,0,0), Shape.TOP);
    setBarBgColor(Color.RGB(0,128,0));
    Strategy.doShort("GET SHORT", Strategy.CLOSE, Strategy.THISBAR, Strategy.DEFAULT, 0);
    vLastAlert = 2;
    }
    //}}EFSWizard_Action_2

    //{{EFSWizard_Action_3
    function onAction3() {
    vLastAlert = 3;
    }
    //}}EFSWizard_Action_3

    //{{EFSWizard_Action_4
    function onAction4() {
    setBarBgColor(Color.RGB(0,128,0));
    Strategy.doLong("GET LONG", Strategy.CLOSE, Strategy.THISBAR, Strategy.DEFAULT, 0);
    if (vLastAlert != 4) drawShapeRelative(0, low(), Shape.UPARROW, "", Color.RGB(0,255,0), Shape.BOTTOM);
    vLastAlert = 4;
    }
    //}}EFSWizard_Action_4

    //}}EFSWizard_Actions
    Last edited by DBBLI; 10-26-2009, 05:35 PM.

  • #2
    MA cross over of an external symbol....Can someone tell me what I'm doing wrong here?

    I'm trying to plot a shape on to an ES #F chart from a Moving Average cross over from another symbol (ex. close() > v10sma(sym($VIX), 1min chart).

    I took the MA Cross Over that was in the EFS file share and the only thing I changed was:

    var vClose = close(0)

    and changed it to:

    var vClose = close(0, ['$VIX' | 1 ]);

    I also added the drawShapeRelative tags for the shape to be drawn on the ES#F chart.

    I'm following the format the EFS editor is showing and that is:

    close([nBarIndex] [, sym | interval ])

    Can someone please tell me where I am going wrong here? I feel stuck on this one issue and it's holding everything else up.

    Here is the full code:

    function preMain() {
    setPriceStudy(true);
    setStudyTitle("MA Cross Over");
    setShowCursorLabel(false);
    setShowTitleParameters(false);

    var fp1 = new FunctionParameter("nInputLength", FunctionParameter.NUMBER);
    fp1.setName("Length");
    fp1.setLowerLimit(1);
    fp1.setDefault(10);
    }

    function main(nInputLength) {

    var vValue = sma(nInputLength);
    var vClose = close(0, ['$VIX' | 1 ]);

    if(vValue != null && vClose != null) {
    if(vClose >= vValue) {
    setBarBgColor(Color.lime);
    drawShapeRelative(0, BelowBar2, Shape.CIRCLE, "", Color.RGB(255,255,0), Shape.LEFT);
    } else {
    setBarBgColor(Color.red);
    drawShapeRelative(0, AboveBar2, Shape.TRIANGLE, "", Color.RGB(255,255,0), Shape.LEFT);
    }
    }

    return;
    }


    At the very least could someone point me in the right direction or point me to an example script I can use as a template to follow regarding getting something from another symbol and plotting that event on a the current chart?

    Thanks in advance.
    Last edited by DBBLI; 11-02-2009, 09:41 AM.

    Comment


    • #3
      Re: MA cross over of an external symbol....Can someone tell me what I'm doing wrong here?

      DBBLI
      The syntax of the following line of your code ie
      var vClose = close(0, ['$VIX' | 1 ]);
      is incorrect and should be
      var vClose = close(0, sym("$VIX,1"));
      You can find the syntax for the close() function complete with all the examples on its use in this article in the EFS KnowledgeBase (note that the square brackets is a convention to indicate that those parameters are optional)
      Alex


      Originally posted by DBBLI
      I'm trying to plot a shape on to an ES #F chart from a Moving Average cross over from another symbol (ex. close() > v10sma(sym($VIX), 1min chart).

      I took the MA Cross Over that was in the EFS file share and the only thing I changed was:

      var vClose = close(0)

      and changed it to:

      var vClose = close(0, ['$VIX' | 1 ]);

      I also added the drawShapeRelative tags for the shape to be drawn on the ES#F chart.

      I'm following the format the EFS editor is showing and that is:

      close([nBarIndex] [, sym | interval ])

      Can someone please tell me where I am going wrong here? I feel stuck on this one issue and it's holding everything else up.

      Here is the full code:

      function preMain() {
      setPriceStudy(true);
      setStudyTitle("MA Cross Over");
      setShowCursorLabel(false);
      setShowTitleParameters(false);

      var fp1 = new FunctionParameter("nInputLength", FunctionParameter.NUMBER);
      fp1.setName("Length");
      fp1.setLowerLimit(1);
      fp1.setDefault(10);
      }

      function main(nInputLength) {

      var vValue = sma(nInputLength);
      var vClose = close(0, ['$VIX' | 1 ]);

      if(vValue != null && vClose != null) {
      if(vClose >= vValue) {
      setBarBgColor(Color.lime);
      drawShapeRelative(0, BelowBar2, Shape.CIRCLE, "", Color.RGB(255,255,0), Shape.LEFT);
      } else {
      setBarBgColor(Color.red);
      drawShapeRelative(0, AboveBar2, Shape.TRIANGLE, "", Color.RGB(255,255,0), Shape.LEFT);
      }
      }

      return;
      }


      At the very least could someone point me in the right direction or point me to an example script I can use as a template to follow regarding getting something from another symbol and plotting that event on a the current chart?

      Thanks in advance.

      Comment


      • #4
        DBBLI
        You can find another complete set of examples on how to use the efs2 functions in this thread
        Alex

        Comment


        • #5
          Re: Re: MA cross over of an external symbol....Can someone tell me what I'm doing wrong here?

          Originally posted by Alexis C. Montenegro
          DBBLI
          The syntax of the following line of your code ie
          var vClose = close(0, ['$VIX' | 1 ]);
          is incorrect and should be
          var vClose = close(0, sym("$VIX,1"));
          You can find the syntax for the close() function complete with all the examples on its use in this article in the EFS KnowledgeBase (note that the square brackets is a convention to indicate that those parameters are optional)
          Alex
          Thank you Alex this was exactly what I needed, as well as the links to the knowledge base... Awesome, thanks!

          Comment


          • #6
            Re: Re: Re: MA cross over of an external symbol....Can someone tell me what I'm doing wrong here?

            DBBLI
            You are welcome
            Alex


            Originally posted by DBBLI
            Thank you Alex this was exactly what I needed, as well as the links to the knowledge base... Awesome, thanks!

            Comment


            • #7
              Different time frame MA cross over not plotting on chart?

              I'm having issues with this script because it is not plotting anything when there is in fact a cross over of moving averages. I'm running this on an ES#F chart. I went back on the $VIX chart and looked at the places at where this cross over would occur and the price values of the moving averages do in fact cross but I get no signal from my script that they do in fact cross.

              This should be pretty straightforward, but I'm just not seeing where I'm going wrong here.

              Help would be greatly appreciated. Here is the script I have so far:


              // $VIX MA Variables

              // $VIX 1-min
              var vVIX200SMA1min = sma(200, sym("$VIX,1"));

              // $VIX 15-min
              var vVIX50SMA15min = sma(50, sym("$VIX,15"));

              var vLastAlert = -1;

              function preMain() {

              setPriceStudy(true);
              setStudyTitle("VIX different time frame MA cross overs");
              setComputeOnClose(false);
              setShowCursorLabel(true);
              setShowTitleParameters(false);

              }

              function main() {


              //{{EFSWizard_Expressions

              //{{EFSWizard_Expression_1 *** Not quite sure if this is correct here, supposed to be the longest MA being used, but...Do you use longest time frame MA or longest period timeframe MA regardless of timeframe you are calling?***
              if (
              vVIX200SMA1min.getValue(MAStudy.MA, -1) == null
              ) onAction1()
              //}}EFSWizard_Expression_1

              //{{EFSWizard_Expression_2 - "Initiate LONG" Position Conditions
              else if (
              Strategy.isLong() == false &&
              vVIX200SMA1min.getValue(MAStudy.MA, -1) > vVIX50SMA15min.getValue(MAStudy.MA, -1) &&
              vVIX200SMA1min.getValue(MAStudy.MA) < vVIX50SMA15min.getValue(MAStudy.MA)
              ) onAction2()
              //}}EFSWizard_Expression_2

              //{{EFSWizard_Expression_3 - "Initiate SHORT" Position Conditions
              else if (
              Strategy.isShort() == false &&
              vVIX200SMA1min.getValue(MAStudy.MA, -1) < vVIX50SMA15min.getValue(MAStudy.MA, -1) &&
              vVIX200SMA1min.getValue(MAStudy.MA) > vVIX50SMA15min.getValue(MAStudy.MA)
              ) onAction3()
              //}}EFSWizard_Expression_3


              //}}EFSWizard_Expressions


              //{{EFSWizard_Return
              return null;
              //}}EFSWizard_Return

              }

              function postMain() {
              /**
              * The postMain() function is called only once, when the EFS is no longer used for
              * the current symbol (ie, symbol change, chart closing, or application shutdown).
              */
              }

              //{{EFSWizard_Actions

              //{{EFSWizard_Action_1
              function onAction1()
              {
              vLastAlert = 1;
              }
              //}}EFSWizard_Action_1

              //{{EFSWizard_Action_2 - "Initiate LONG" Position - Actions Taken
              function onAction2()
              {
              if (vLastAlert != 2) Strategy.doLong("Initiate LONG", Strategy.MARKET, Strategy.THISBAR, Strategy.DEFAULT, 0);
              drawTextRelative(0, BelowBar2, "LONG", Color.RGB(0,0,255), Color.RGB(255,255,0), Text.PRESET | Text.BOLD, "Arial", 13);
              setBarBgColor(Color.RGB(0,255,0));
              vLastAlert = 2;
              }
              //}}EFSWizard_Action_2

              //{{EFSWizard_Action_3 - "Initiate SHORT" Position - Actions Taken
              function onAction3()
              {
              if (vLastAlert != 3) Strategy.doShort("Initiate SHORT", Strategy.MARKET, Strategy.THISBAR, Strategy.DEFAULT, 0);
              drawTextRelative(0, AboveBar2, "SHORT", Color.RGB(255,0,0), Color.RGB(255,255,0), Text.PRESET | Text.BOLD, "Arial", 13);
              setBarBgColor(Color.RGB(255,0,0));
              vLastAlert = 3;
              }
              //}}EFSWizard_Action_3

              //}}EFSWizard_Actions

              Comment


              • #8
                Hi,

                Unless I am missing something basic I agree with DBBLI.

                The following efs should mark all sma() crosses since the "Flag" was commented out in the conditional statement.

                However, when the intervals are different many sma() crosses are not marked while all are marked when the intervals are the same.

                This efs allows this by running it twice on a 15 min chart of the $VIX and just changing the interval from 1 to 15 in the menu (affects the 200 sma only). By changing the interval, you either match the 15 min interval for the 50 sma or make it different when you choose 1 for the 200 sma interval.

                A chart is attached with the top pane study displaying the different intervals for each sma() and the bottom pane study displaying crosses when the intervals are 15 for both the 200 sma and the 50 sma showing were the efs marks the cross.

                Any ideas of why it does this? Could it be a bug?

                Thanks,

                Wayne
                PHP Code:
                var aFPArray = new Array(); 

                function 
                preMain() {
                    
                setPriceStudy(false);
                    
                setStudyTitle("VIX Different Interval MA Cross");

                    var 
                x=0;     
                    
                aFPArray[x] = new FunctionParameter"MA0_Int"FunctionParameter.STRING); 
                    
                withaFPArray[x++] ) { 
                        
                setName"MA0 Interval" ); 
                        
                addOption"1" );
                        
                addOption"15" );
                        
                setDefault"1" ); 
                    }   
                }
                var 
                bInit false;
                var 
                grID 0;
                var 
                Flag 0;
                var 
                vMA0 null;
                var 
                vMA1 null;

                function 
                main(MA0_Int){
                    if(
                bInit == false){
                        
                setCursorLabelName("MA0- I15, L200"); 
                        
                setCursorLabelName("MA1- I15, L50"); 
                        
                setDefaultBarFgColor(Color.green0);
                        
                setDefaultBarFgColor(Color.red1);
                        
                setDefaultBarThickness(20); 
                        
                setDefaultBarThickness(31); 
                        
                setDefaultBarStylePS_SOLID); 
                        
                setDefaultBarStylePS_SOLID);

                        
                vMA0 getSeries(offsetSeries(sma(200,close(sym("$VIX,"+MA0_Int))),0));
                        
                vMA1 getSeries(offsetSeries(sma(50,close(sym("$VIX,15"))),0));

                        
                bInit true;
                    }
                    
                xMA0_0 vMA0.getValue(0);
                    
                xMA0_1 vMA0.getValue(-1);
                    
                xMA1_0 vMA1.getValue(0);
                    
                xMA1_1 vMA1.getValue(-1);

                    if(
                xMA0_1 >= xMA1_1 && xMA0_0 xMA1_0){// && Flag != 1){
                        
                drawTextRelative(0TopRow1"LONG"Color.RGB(0,0,255), Color.RGB(255,255,0), Text.PRESET Text.TOP Text.BOLD"Arial"13,"L"+gID());
                        
                setBarBgColor(Color.black);
                        
                Flag 1;
                    } 
                    if (
                xMA0_1 <= xMA1_1 && xMA0_0 xMA1_0){// && Flag != -1){
                        
                drawTextRelative(0TopRow1"SHORT"Color.RGB(255,0,0), Color.RGB(255,255,0), Text.PRESET Text.TOP Text.BOLD"Arial"13,"S"+gID());
                        
                setBarBgColor(Color.RGB(255,0,0));
                        
                Flag = -1;
                    }

                    return new Array(
                vMA0,vMA1);
                }
                //== gID function assigns unique identifier to graphic/text routines
                function gID() {
                    
                grID ++;
                    return( 
                grID );

                Attached Files
                Last edited by waynecd; 11-10-2009, 07:41 PM.

                Comment


                • #9
                  Hi DBBLI, waynecd,

                  I believe this is simply a bug in the posted efs. I believe things are working as I would expect they should.

                  This started with a relatively simple efs that Alex helped with, then shifted to overdrive into multiple interval data without a good understanding how data is loaded onto the chart (which in this case, is not so simple a concept).

                  Thanks for posting the code, it helps to figure this out, and thanks for trying to knuke it out Wayne, your rewrite and analysis was helpful as well.

                  From my understanding of external intervals and chart intervals in EFS2, you will have granularity issues between them , primarily (but not limited to) when you load historical data. e.g. for each bar of the chart interval, you may have seven bars on the external interval. So when you are comparing them for crossovers, you would need to compare the most recent external interval value and the value from the external interval from 7 bars ago.

                  To see this, put the barcount as a return value from the external interval. Place some debug statements in the efs and output the external barcounts. You'll see the granularity I'm talking about when you do this.

                  Once you accomplish this, you should be able to use the returned barcount to address the correct index value from the returned chart.

                  There are other issues with the code as well. By comparing these values every tick, you will never be able to get consistency when your historical data loads, since the historical data loads end of bar data, not intermediate tick data.

                  What you have to figure out is how to compare prices in the different intervals the same way whether you are loading historical data or getting live data.

                  Hope this helps.

                  Comment


                  • #10
                    Re: Different time frame MA cross over not plotting on chart?

                    DBBLI
                    To add to what Steve said there is also a syntax error in your code in the use of the getValue() method when you retrieve the values of the sma() series objects. To do this you are using the legacy syntax ie xxx.getValue(MAStudy.MA, n) whereas you need to use the efs2 syntax ie xxx.getValue(n) because you are calling efs2 functions (see this article in the EFS KnowledgeBase for the description and syntax of the moving average functions).
                    Once you correct this error the script will work and signal the crossover points.
                    You may however not see any unless you load a considerable number of bars on your chart as they willl occur infrequently given the settings used for the indicators.
                    To verify that the script is working try using a smaller external interval such as for example 5 minutes. Once you do that you will see that the script is in fact generating those signals (see the screenshot enclosed below which was captured using a 5 minute interval instead of 15)
                    That said there are also a few logical issues some of which Steve has already pointed out.
                    One is the use of Strategy.MARKET as the FillType in the Strategy.doLong() and Strategy.doShort() commands (for the complete description and syntax of these commands see the corresponding articles in the Function Reference-> Back Testing folder of the EFS KnowledgeBase). Strategy.MARKET equates to the opening price of a bar and not to the current price and its use in this instance could lead to unrealistic results when backtesting.
                    You may want to review the Back Testing tutorials on the proper use of the Strategy Object. These are available in the EFS KnowledgeBase in the Help Guides and Tutorials-> Beginner Tutorials folder
                    Another issue is that the logic used in the conditional statements is such that it could in some instances return results that are different from what you are looking for. FWIW if you translate the conditions into plain language these would read
                    "if the value of the 1 minute sma at the prior 1 minute bar is lower [or higher] than the value of the 15 minute sma at the prior 15 minute bar AND the value of the 1 minute sma at the current 1 minute bar is higher [or lower] than the value of the 15 minute sma at the current 15 minute bar"
                    Note that the results generated by the formula will match the conditional statements and you can verify them through the appropriate use of debug statements as Steve already suggested (see the debugPrint() and debugPrintln() functions in the EFS KnowledgeBase)
                    This also relates to the behavior that Steve already mentioned. With regards to this you may also want to read my post in this thread
                    Alex


                    Originally posted by DBBLI
                    I'm having issues with this script because it is not plotting anything when there is in fact a cross over of moving averages. I'm running this on an ES#F chart. I went back on the $VIX chart and looked at the places at where this cross over would occur and the price values of the moving averages do in fact cross but I get no signal from my script that they do in fact cross.

                    This should be pretty straightforward, but I'm just not seeing where I'm going wrong here.

                    Help would be greatly appreciated. Here is the script I have so far:


                    // $VIX MA Variables

                    // $VIX 1-min
                    var vVIX200SMA1min = sma(200, sym("$VIX,1"));

                    // $VIX 15-min
                    var vVIX50SMA15min = sma(50, sym("$VIX,15"));

                    var vLastAlert = -1;

                    function preMain() {

                    setPriceStudy(true);
                    setStudyTitle("VIX different time frame MA cross overs");
                    setComputeOnClose(false);
                    setShowCursorLabel(true);
                    setShowTitleParameters(false);

                    }

                    function main() {


                    //{{EFSWizard_Expressions

                    //{{EFSWizard_Expression_1 *** Not quite sure if this is correct here, supposed to be the longest MA being used, but...Do you use longest time frame MA or longest period timeframe MA regardless of timeframe you are calling?***
                    if (
                    vVIX200SMA1min.getValue(MAStudy.MA, -1) == null
                    ) onAction1()
                    //}}EFSWizard_Expression_1

                    //{{EFSWizard_Expression_2 - "Initiate LONG" Position Conditions
                    else if (
                    Strategy.isLong() == false &&
                    vVIX200SMA1min.getValue(MAStudy.MA, -1) > vVIX50SMA15min.getValue(MAStudy.MA, -1) &&
                    vVIX200SMA1min.getValue(MAStudy.MA) < vVIX50SMA15min.getValue(MAStudy.MA)
                    ) onAction2()
                    //}}EFSWizard_Expression_2

                    //{{EFSWizard_Expression_3 - "Initiate SHORT" Position Conditions
                    else if (
                    Strategy.isShort() == false &&
                    vVIX200SMA1min.getValue(MAStudy.MA, -1) < vVIX50SMA15min.getValue(MAStudy.MA, -1) &&
                    vVIX200SMA1min.getValue(MAStudy.MA) > vVIX50SMA15min.getValue(MAStudy.MA)
                    ) onAction3()
                    //}}EFSWizard_Expression_3


                    //}}EFSWizard_Expressions


                    //{{EFSWizard_Return
                    return null;
                    //}}EFSWizard_Return

                    }

                    function postMain() {
                    /**
                    * The postMain() function is called only once, when the EFS is no longer used for
                    * the current symbol (ie, symbol change, chart closing, or application shutdown).
                    */
                    }

                    //{{EFSWizard_Actions

                    //{{EFSWizard_Action_1
                    function onAction1()
                    {
                    vLastAlert = 1;
                    }
                    //}}EFSWizard_Action_1

                    //{{EFSWizard_Action_2 - "Initiate LONG" Position - Actions Taken
                    function onAction2()
                    {
                    if (vLastAlert != 2) Strategy.doLong("Initiate LONG", Strategy.MARKET, Strategy.THISBAR, Strategy.DEFAULT, 0);
                    drawTextRelative(0, BelowBar2, "LONG", Color.RGB(0,0,255), Color.RGB(255,255,0), Text.PRESET | Text.BOLD, "Arial", 13);
                    setBarBgColor(Color.RGB(0,255,0));
                    vLastAlert = 2;
                    }
                    //}}EFSWizard_Action_2

                    //{{EFSWizard_Action_3 - "Initiate SHORT" Position - Actions Taken
                    function onAction3()
                    {
                    if (vLastAlert != 3) Strategy.doShort("Initiate SHORT", Strategy.MARKET, Strategy.THISBAR, Strategy.DEFAULT, 0);
                    drawTextRelative(0, AboveBar2, "SHORT", Color.RGB(255,0,0), Color.RGB(255,255,0), Text.PRESET | Text.BOLD, "Arial", 13);
                    setBarBgColor(Color.RGB(255,0,0));
                    vLastAlert = 3;
                    }
                    //}}EFSWizard_Action_3

                    //}}EFSWizard_Actions

                    Comment


                    • #11
                      Hi Steve and Alex,

                      Thanks for the very detailed and thought out explanations. It also helps with other quirks I've come up against.

                      I'll test this over the next week or so.

                      Wayne
                      Last edited by waynecd; 11-11-2009, 07:08 AM.

                      Comment


                      • #12
                        Hi,

                        DBBLI, I hope you don't mind me working in your thread but will start another if you do. Hopefully we can both benefit.
                        I've tested as suggested below even using the "getBarStateInterval()" and "getBarStateSymbol()" and found that just assigning values to the single value variables on new bars of the current interval marks each cross.

                        It only works on a 1 minute chart of the $VIX.

                        PHP Code:
                             var nState getBarState();
                             var 
                        xMA0_0,xMA0_1,xMA1_0,xMA1_1
                            if(
                        nState == BARSTATE_NEWBAR){ 
                                
                        xMA0_0 vMA0.getValue(0);
                                
                        xMA0_1 vMA0.getValue(-1);
                                
                        xMA1_0 vMA1.getValue(0);
                                
                        xMA1_1 vMA1.getValue(-1);
                            } 
                        But it gives wrong signals due to the granularity issue (from what I understand from the info below and the testing I did). Each signal should be a thin line so the thick lines represent several signals triggered while the longer term interval fluctuates resulting in a coin toss for the last signal of a long or a short. Using "getBarStateInterval()" or "getBarStateSymbol()" doesn't help (I tried it in different locations).

                        Any ideas on how to get accurate signals?

                        Here is the new script:

                        PHP Code:
                        function preMain() {
                            
                        setPriceStudy(false);
                            
                        setStudyTitle("VIX Different Interval MA Cross Simple");
                        }
                        var 
                        bInit false;
                        var 
                        grID 0;
                        var 
                        vMA0 null;
                        var 
                        vMA1 null;

                        function 
                        main(MA0_Int,MA1_Int){

                            var 
                        nState getBarState();
                            var 
                        xMA0_0,xMA0_1,xMA1_0,xMA1_1
                            if(
                        bInit == false){
                                
                        setCursorLabelName("MA0- I1, L200"); 
                                
                        setCursorLabelName("MA1- I15, L50"); 
                                
                        setDefaultBarFgColor(Color.green0);
                                
                        setDefaultBarFgColor(Color.red1);
                                
                        setDefaultBarThickness(20); 
                                
                        setDefaultBarThickness(31); 
                                
                        setDefaultBarStylePS_SOLID); 
                                
                        setDefaultBarStylePS_SOLID);

                                
                        vMA0 getSeries(offsetSeries(sma(200,close(sym("$VIX,1"))),0));
                                
                        vMA1 getSeries(offsetSeries(sma(50,close(sym("$VIX,15"))),0));

                                
                        bInit true;
                            }
                            var 
                        nState getBarState();
                            var 
                        xMA0_0,xMA0_1,xMA1_0,xMA1_1
                            if(
                        nState == BARSTATE_NEWBAR){ 
                                
                        xMA0_0 vMA0.getValue(0);
                                
                        xMA0_1 vMA0.getValue(-1);
                                
                        xMA1_0 vMA1.getValue(0);
                                
                        xMA1_1 vMA1.getValue(-1);
                            }
                            if(
                        xMA0_1 != null && xMA1_1 != null && xMA0_0 != null && xMA1_0 != null){
                                if(
                        xMA0_1 xMA1_1 && xMA0_0 xMA1_0 ){// && Flag != 1 ){
                                    
                        drawTextRelative(0TopRow1"LONG"Color.RGB(0,0,255), Color.RGB(255,255,0), Text.PRESET Text.TOP Text.BOLD"Arial"13,"L"+gID());
                                    
                        setBarBgColor(Color.black);
                                    
                        Flag 1;
                                } 
                                if (
                        xMA0_1 xMA1_1 && xMA0_0 xMA1_0){// && Flag != -1 ){
                                    
                        drawTextRelative(0TopRow1"SHORT"Color.RGB(255,0,0), Color.RGB(255,255,0), Text.PRESET Text.TOP Text.BOLD"Arial"13,"S"+gID());
                                    
                        setBarBgColor(Color.RGB(255,0,0));
                                    
                        Flag = -1;
                                }
                            }    
                            return new Array(
                        vMA0,vMA1);
                        }
                        //== gID function assigns unique identifier to graphic/text routines
                        function gID() {
                            
                        grID ++;
                            return( 
                        grID );


                        Thanks,

                        Wayne
                        Attached Files
                        Last edited by waynecd; 11-11-2009, 04:47 PM.

                        Comment


                        • #13
                          Originally posted by waynecd
                          Hi,

                          DBBLI, I hope you don't mind me working in your thread but will start another if you do. Hopefully we can both benefit.
                          waynecd, I don't mind at all, the last few posts have been very helpful. Thank you Alex and stevehare2003 for your insights. I'm going to need some time to go over those links and review my code. But this is definitely helping!

                          Comment


                          • #14
                            Hi Steve,

                            Maybe the answer to the wrong signals issue requires me to understand better what you meant by "use the returned barcount to address the correct index value from the returned chart." I think I still need to do more testing for that since I'm not seeing it with the tests I've done so far.


                            To see this, put the barcount as a return value from the external interval. Place some debug statements in the efs and output the external barcounts. You'll see the granularity I'm talking about when you do this.

                            Once you accomplish this, you should be able to use the returned barcount to address the correct index value from the returned chart.
                            Wayne
                            Last edited by waynecd; 11-11-2009, 07:12 PM.

                            Comment


                            • #15
                              Hi Wayne,

                              I created an efs in where I demonstrate the concept of granularity (with respect to a smaller interval series) that I tried to explain earlier. I attached a copy in addition to uploading a copy to my fileshare. Please read the precautions and other notes in the efs prior to running it.

                              I hope you find this helpful.

                              Originally posted by waynecd
                              Hi Steve,

                              Maybe the answer to the wrong signals issue requires me to understand better what you meant by "use the returned barcount to address the correct index value from the returned chart." I think I still need to do more testing for that since I'm not seeing it with the tests I've done so far.


                              Wayne
                              Attached Files

                              Comment

                              Working...
                              X