Announcement

Collapse
No announcement yet.

Stochastics Formula Wizard

Collapse
X
 
  • Filter
  • Time
  • Show
Clear All
new posts

  • #16
    Originally posted by Alexis C. Montenegro
    JR
    The link is now fixed. You may want to try it again
    Alex
    Hi Alex,

    Thanks for your continuing help. However, I have tried that particular efs script and it does not have what I need. I am trying to learn the code to write my own but that may take forever. Any other ideas you may have will be appreciated.

    Sincerely,
    JR

    Comment


    • #17
      JR
      Can you post an image of the Stochastic plot from the formula that you posted? If possible use $INDU on a daily interval for the data series.
      Alex

      Comment


      • #18
        Originally posted by Alexis C. Montenegro
        JR
        Can you post an image of the Stochastic plot from the formula that you posted? If possible use $INDU on a daily interval for the data series.
        Alex
        Alex,

        I have it on two currency platforms, Intellicharts and GFT, and therefore cannot show you the Dow. I can show you using a currency pair. Can I email it to you? I am Bulletin Board challenged. I will need your email.

        JR

        Comment


        • #19
          Originally posted by uphill
          Alex,

          I have it on two currency platforms, Intellicharts and GFT, and therefore cannot show you the Dow. I can show you using a currency pair. Can I email it to you? I am Bulletin Board challenged. I will need your email.

          JR
          I noticed how to attach it. Here it is:

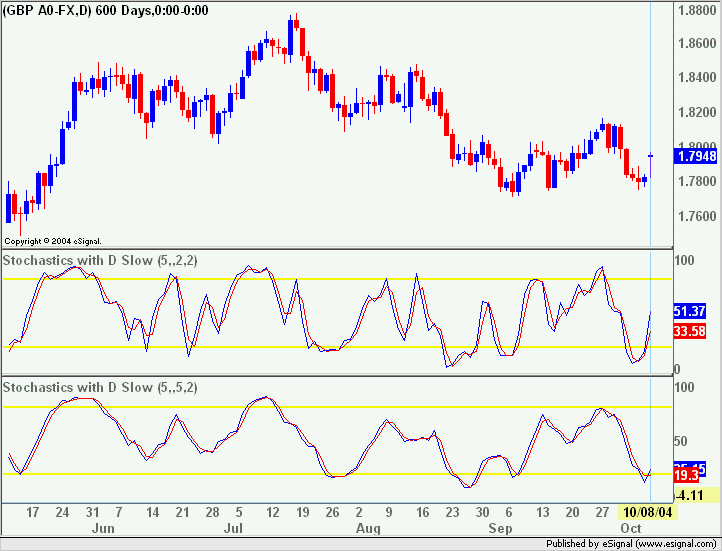
          The symbol for this currency pair on eSignal is: GBP A0-FX

          This is the type of Slow Stochastics chart that I want to do on eSignal. I want to be able to change the hi, lo lines and the K's and D's that you can see.

          Thanks!
          Attached Files
          Last edited by uphill; 10-09-2004, 07:32 AM.

          Comment


          • #20
            JR
            I found a site that uses Intellicharts and I think I understand where the differences are.
            Try the attached variant of the StochWithDSlow and set the parameters in the following way to replicate your chart.
            For the 5,2,2 set them in eSignal to 5,1,2,2. For the 5,5,2 set them to 5,1,5,2 (IOW set nKSmoothing to 1 or leave it empty as it is already set to 1 by default). The results of these settings are shown in the image below
            Note that there may still be slight differences in the values of the plots due to the different data series but the shapes of the plots should correspond
            Alex

            Attached Files

            Comment


            • #21
              Thanks Alex!!! I''ll test it like crazy and let you know. Looks good though.

              JR


              Edit: Alex,

              You are AWESOME!!! That did it. Thanks!!!!!!!!!!!!!!!!!

              I have been trying to solve this for 6 months.

              You're the best!

              JR
              Last edited by uphill; 10-09-2004, 11:09 PM.

              Comment


              • #22
                JR
                My pleasure and thank you for the compliments.
                Truth be told the merit goes to Jason who had already programmed the efs. All I did was remove the %K plot from the return leaving only %D and %D Slow.
                More importantly glad to hear that you now have what you have been looking for.
                Alex

                Comment

                Working...
                X