Announcement

Collapse
No announcement yet.

How to recude the RSI range displayed on chart

Collapse
X
 
  • Filter
  • Time
  • Show
Clear All
new posts

  • How to recude the RSI range displayed on chart

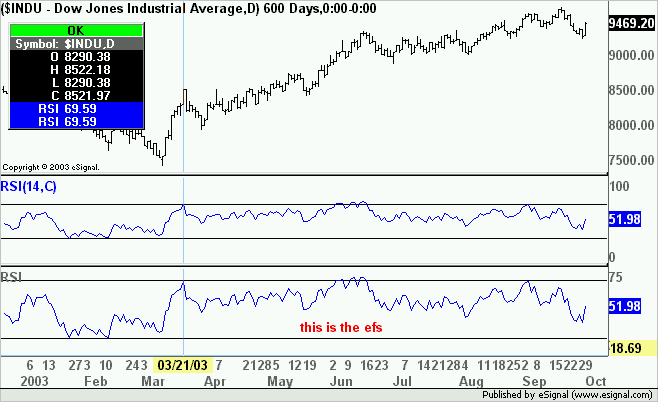
    On a minute (advanced) chart the RSI (14,C) chart the line hardly ever goes outside 75-25 range. When tiling studies the RSI takes too much space. How can I make it more compact by fe reducing chart range from current 0-100 to, say 20-80.

    I see that various other charting packages offer that service.
    thanks


    PS.

  • #2
    jpadt
    You cannot do it with the Basic Study but you can with an efs (see image below).
    Attached is an efs that fully replicates the one in the Basic Study and where the upper and lower limits for the window have been set at 78 and 18 respectively.
    If you want to change these values open the formula with the Editor and modify the setStudyMin and setStudyMax values.
    Alex

    Attached Files

    Comment


    • #3
      Thank you.

      Comment

      Working...
      X