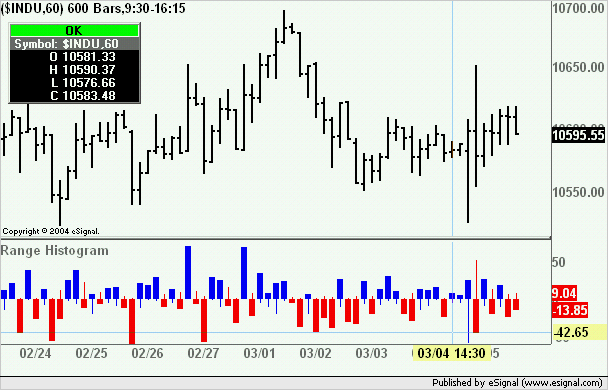
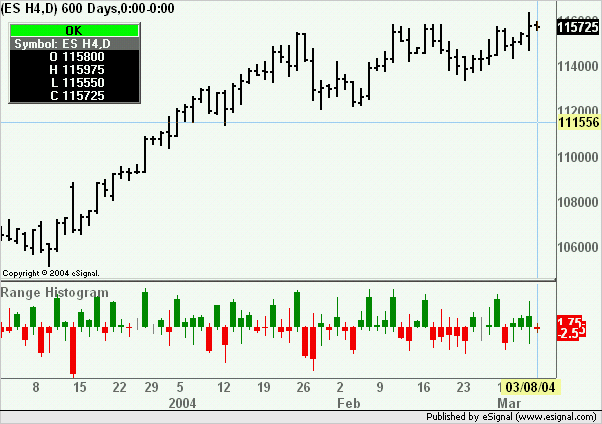
I would like to be able to view candlesticks in a histogram format. The candles would be plotted with the open on the zero line. Up candles could have a wick below the zero line to represent the low. Down candles could have a wick above the zero line to represent the high of that candle.
The purpose of the study would be to quickly see how the momentum of range of the candles was increasing or decreasing, in addition to changing direction.
The purpose of the study would be to quickly see how the momentum of range of the candles was increasing or decreasing, in addition to changing direction.


Comment