Announcement

Collapse
No announcement yet.

range histogram

Collapse
X
 
  • Filter
  • Time
  • Show
Clear All
new posts

  • range histogram

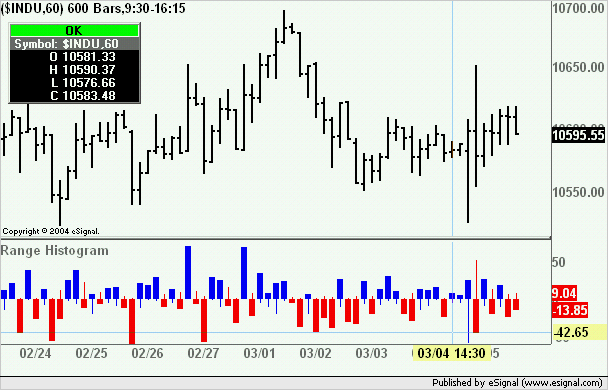
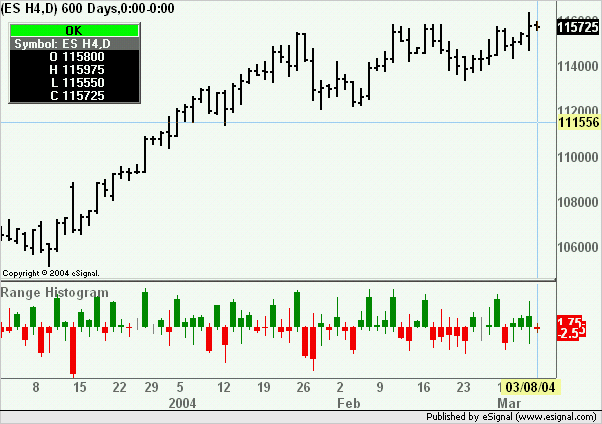
    I would like to be able to view candlesticks in a histogram format. The candles would be plotted with the open on the zero line. Up candles could have a wick below the zero line to represent the low. Down candles could have a wick above the zero line to represent the high of that candle.

    The purpose of the study would be to quickly see how the momentum of range of the candles was increasing or decreasing, in addition to changing direction.

  • #2
    cadbleu
    The attached efs should do what you asked
    Alex

    Attached Files

    Comment


    • #3
      awsome!!!

      One minor change would be requested. I noticed that you were able to create the wicks of the candles for the tails around the zero line but not the upper tails on the positive candles or the lower tails on the negative candles. Is this possible?

      2nd (even less minor note). Is it possible to change the up candles to green?

      Thanks so much.....

      Stephan

      Comment


      • #4
        Stephan
        Yes it is, I just did not know you wanted it that way.
        Will post revision shortly
        Alex

        Comment


        • #5
          Stephan
          The attached revision of the efs implements the changes you requested
          Alex

          Attached Files

          Comment

          Working...
          X